Daily TA - S&P 500
Trend & Structure (SMA Analysis)
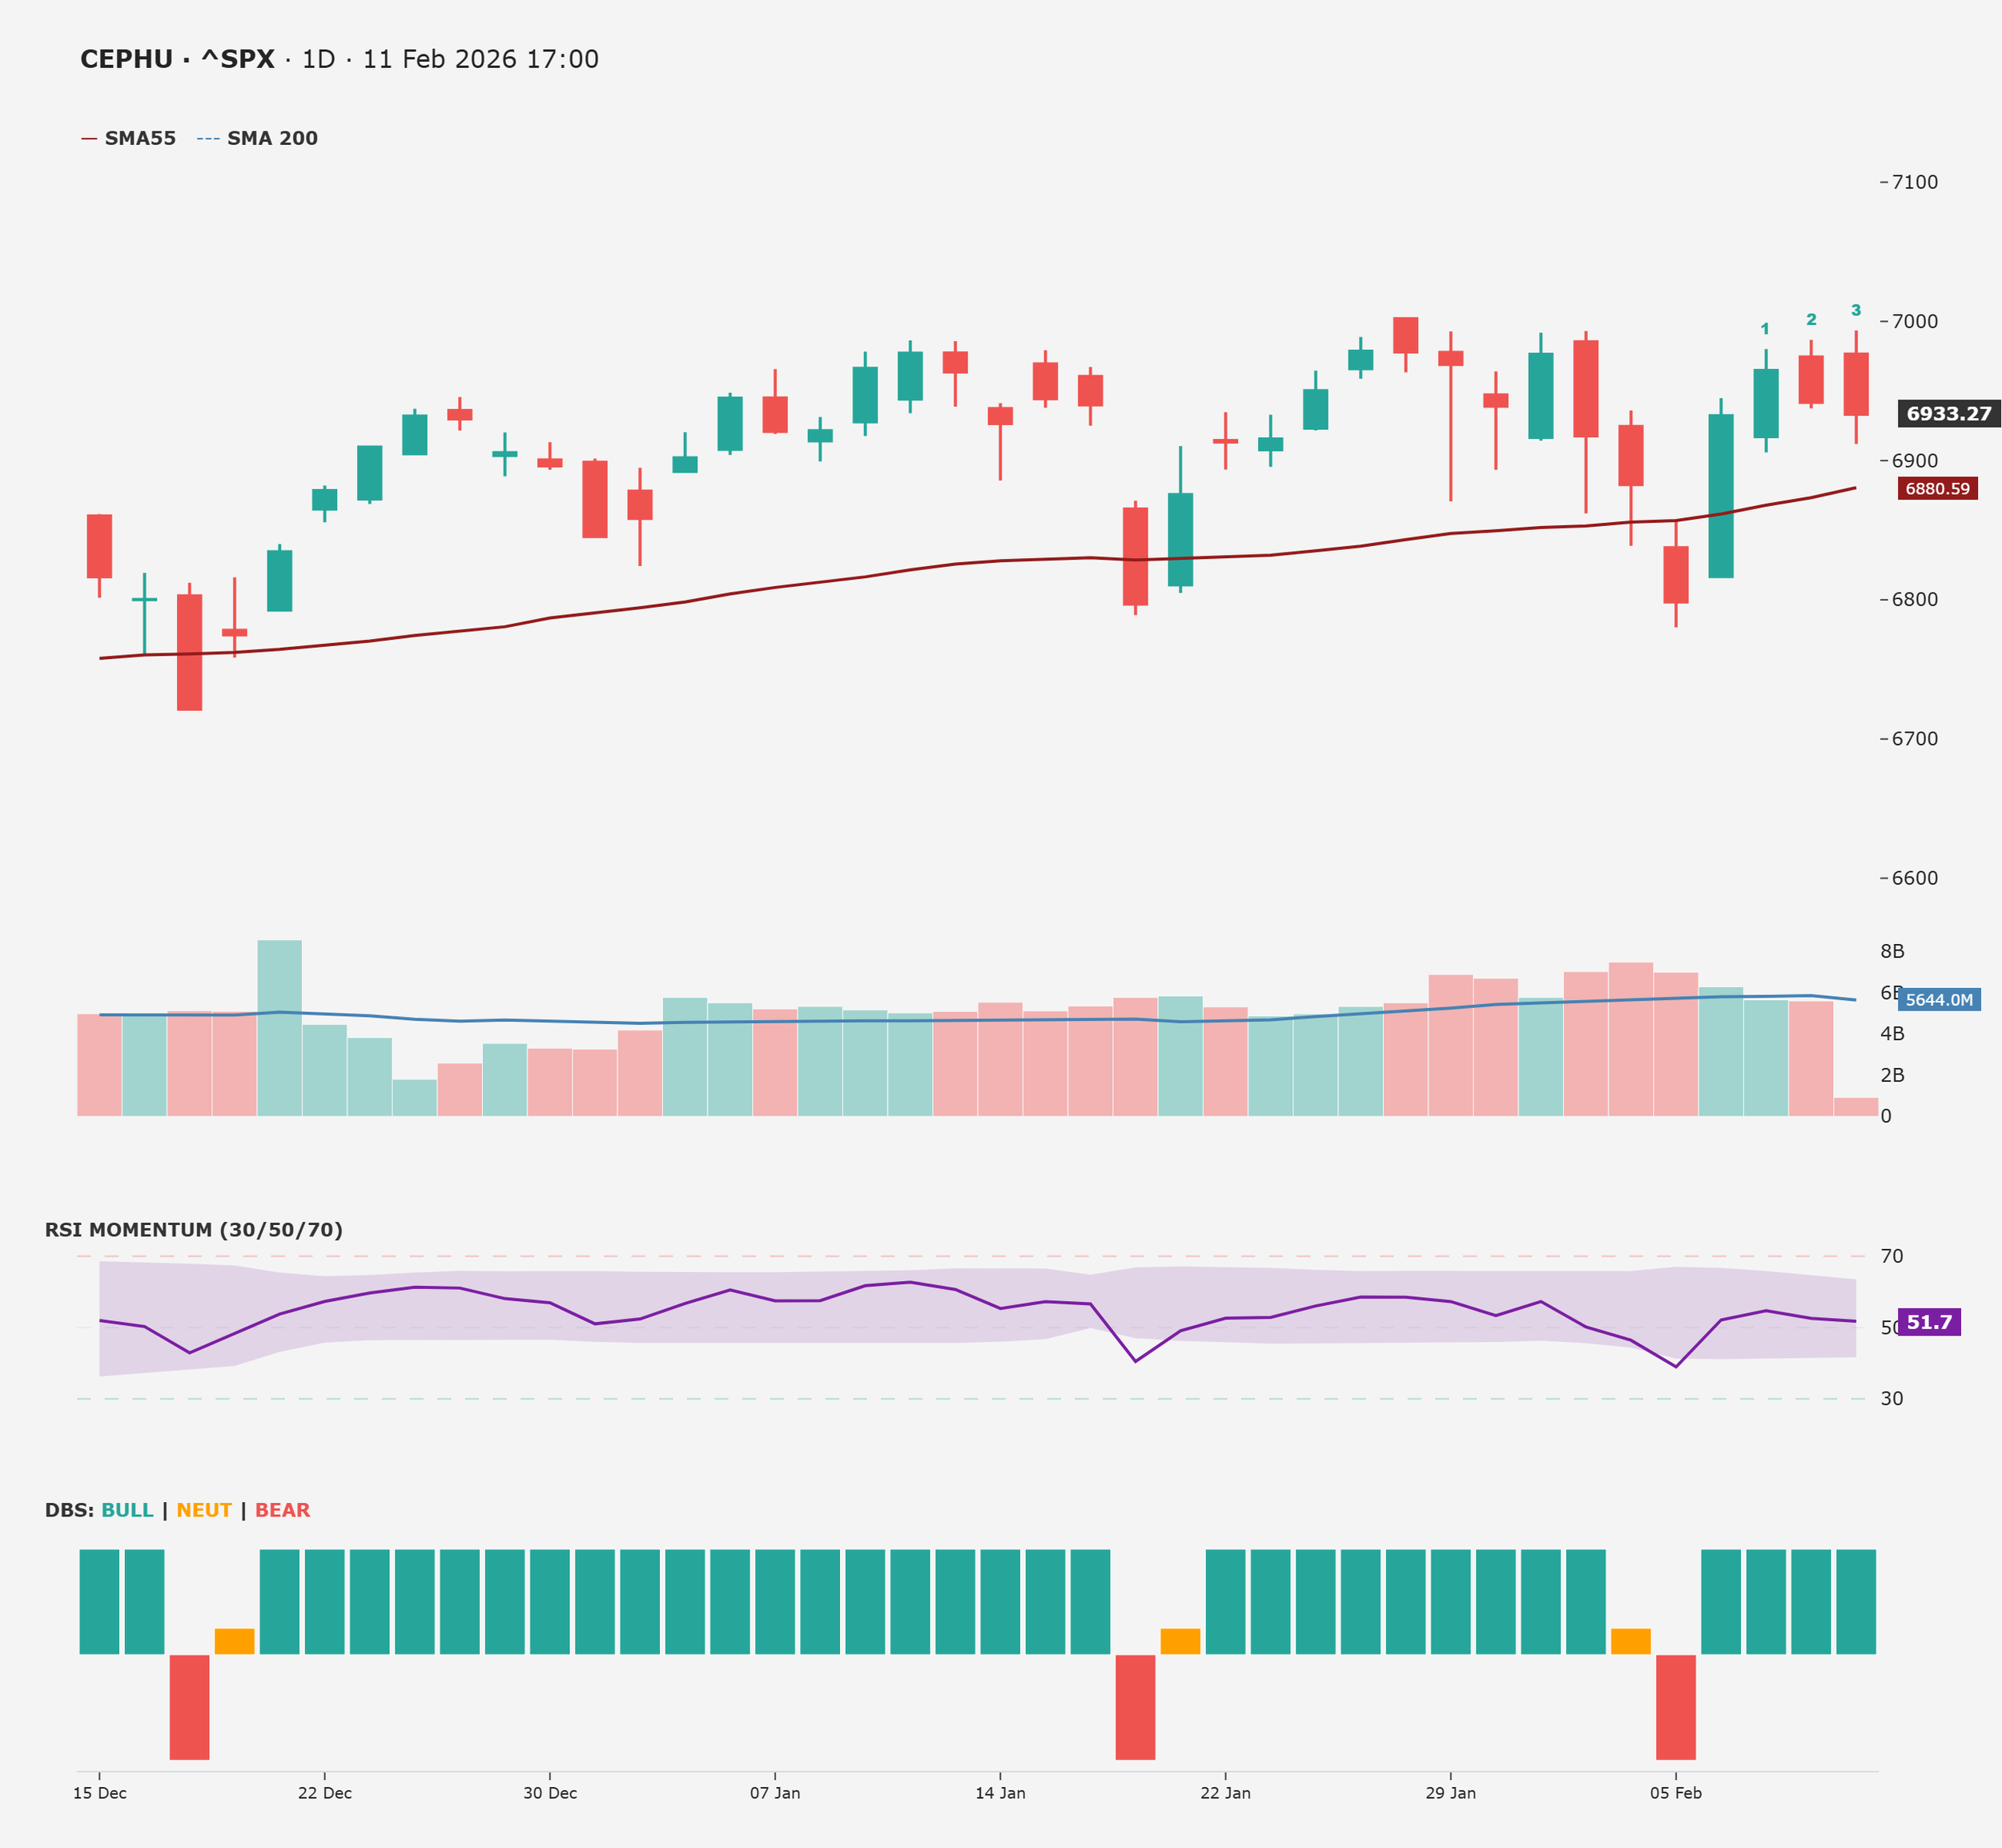
Primary Trend: The long-term outlook remains structurally bullish as the index continues to trade comfortably above the rising SMA 200.
Intermediate Trend: Price action has successfully rebounded from the recent test of the SMA 55 (6880.59). Instead of a breakdown, the moving average acted as a launchpad for the current rally.
Short-term Trend: The consolidation phase from late January has been broken. With three consecutive green candles above the SMA 55, the short-term trend has resolutely shifted from corrective back to expansive.
Key takeaway:
“As long as price holds above the SMA 55 (6880), the structural bias remains positive and focused on price discovery above the 7000 level.”
Swing Sequencer
Current Swing Count: 3 (Bullish Expansion)
Today’s Signal: Green candle with a Green Swing Count "3".
Interpretation: The bullish cycle that began three sessions ago is gaining momentum. We are seeing a "higher high" relative to the previous two days, indicating sustained buying pressure and trend confirmation.
Key takeaway:
“The upward swing is in full swing. The market shows strong continuity after neutralizing the previous bearish pressure.”
Momentum (RSI)
RSI Value: 51.7
Zone: Neutral / Bullish.
Behavior: The RSI is flattening slightly around 51.7 but remains stable above the critical 50-midline.
Interpretation: Despite the price increase, the RSI is nowhere near "overbought" territory (70+). This is a healthy sign; it suggests the current move is not overheated and there is ample "fuel" for further gains without immediate exhaustion.
Key takeaway:
“RSI at 51.7 confirms that the current rally is supported by healthy momentum, leaving room for an assault on the psychological 7000 barrier.”
Key Levels to Watch
Support:
S1: 6900 (Psychological Support)
S2: 6880 (SMA 55)
Resistance:
R1: 7000 (Major Psychological Barrier & Recent High)
R2: 7040 (All-time High Zone)
Key takeaway:
“The focus is now entirely on the 7000 level. A daily close above this mark would confirm a breakout toward 7040 and beyond.”
Outlook for the Next Trading Day
The S&P 500 enters the next session with an active Swing Count 3 and a strong position above all short-term moving averages.
Bullish Scenario: A continuation of the current trend with a test of 7000. As long as bulls hold today's closing area (6933), momentum remains firmly in their favor.
Bearish Scenario: Only a drop back below 6880 (SMA 55) would weaken the current bullish structure and return the market to a consolidation phase.
Support My Work
If you appreciate these clear, structured daily analyses, you can support the work via the donation page. Your contribution keeps Cephu independent and ad‑free.