Request Your Custom Analysis
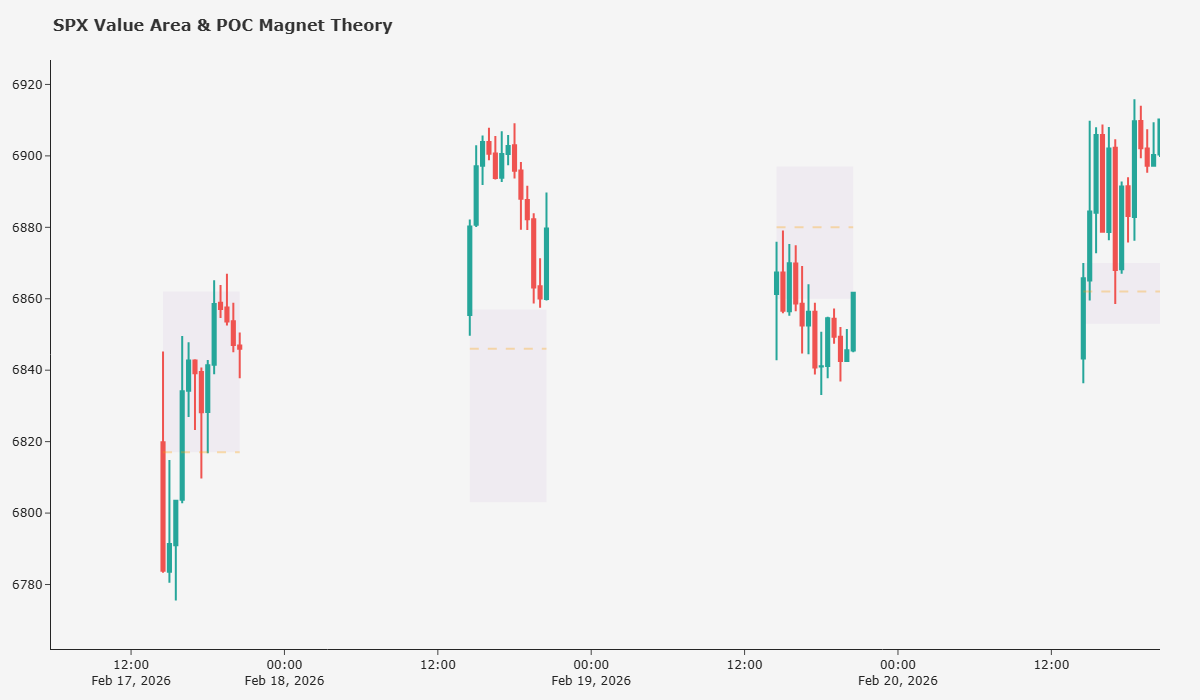
Quantitative Research Report: The Magnetism of Fair Value
Subject: Statistical Significance of the Volume Point of Control (vPOC) in the S&P 500
Author: Cephu Research Lab
Date: February 2026
Data Horizon: Rolling 6-Month Window
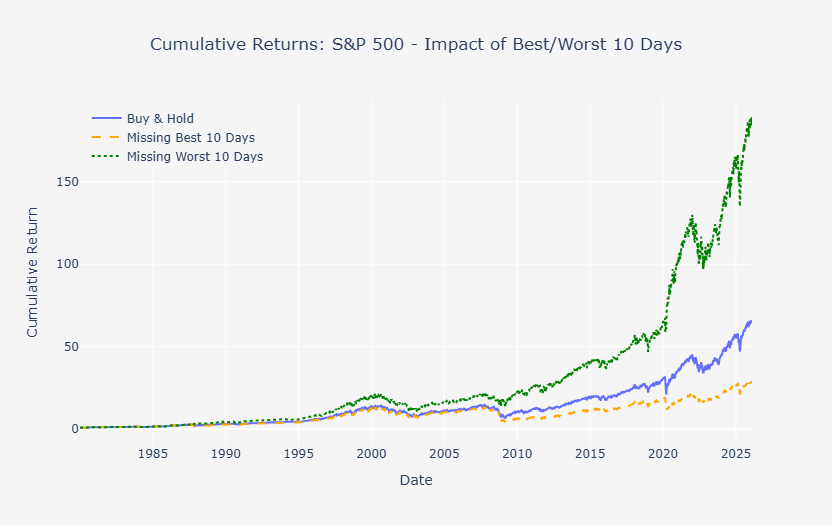
Does Missing the Best Market Days Really Destroy Returns?
What really happens if you miss the “10 best market days”?
This popular investment claim is repeated everywhere — but rarely examined with real data. In this quantitative study, we analyse S&P 500 returns from 1980 to 2025, extract the actual best and worst days in the market, and compare three strategies: buy‑and‑hold, missing the best days, and avoiding the worst days. The results reveal a surprising truth: extreme up‑ and down‑moves cluster together, making market timing far harder than it seems. This research cuts through the myth with hard numbers, clear visualizations, and data‑driven insights for long‑term investors.
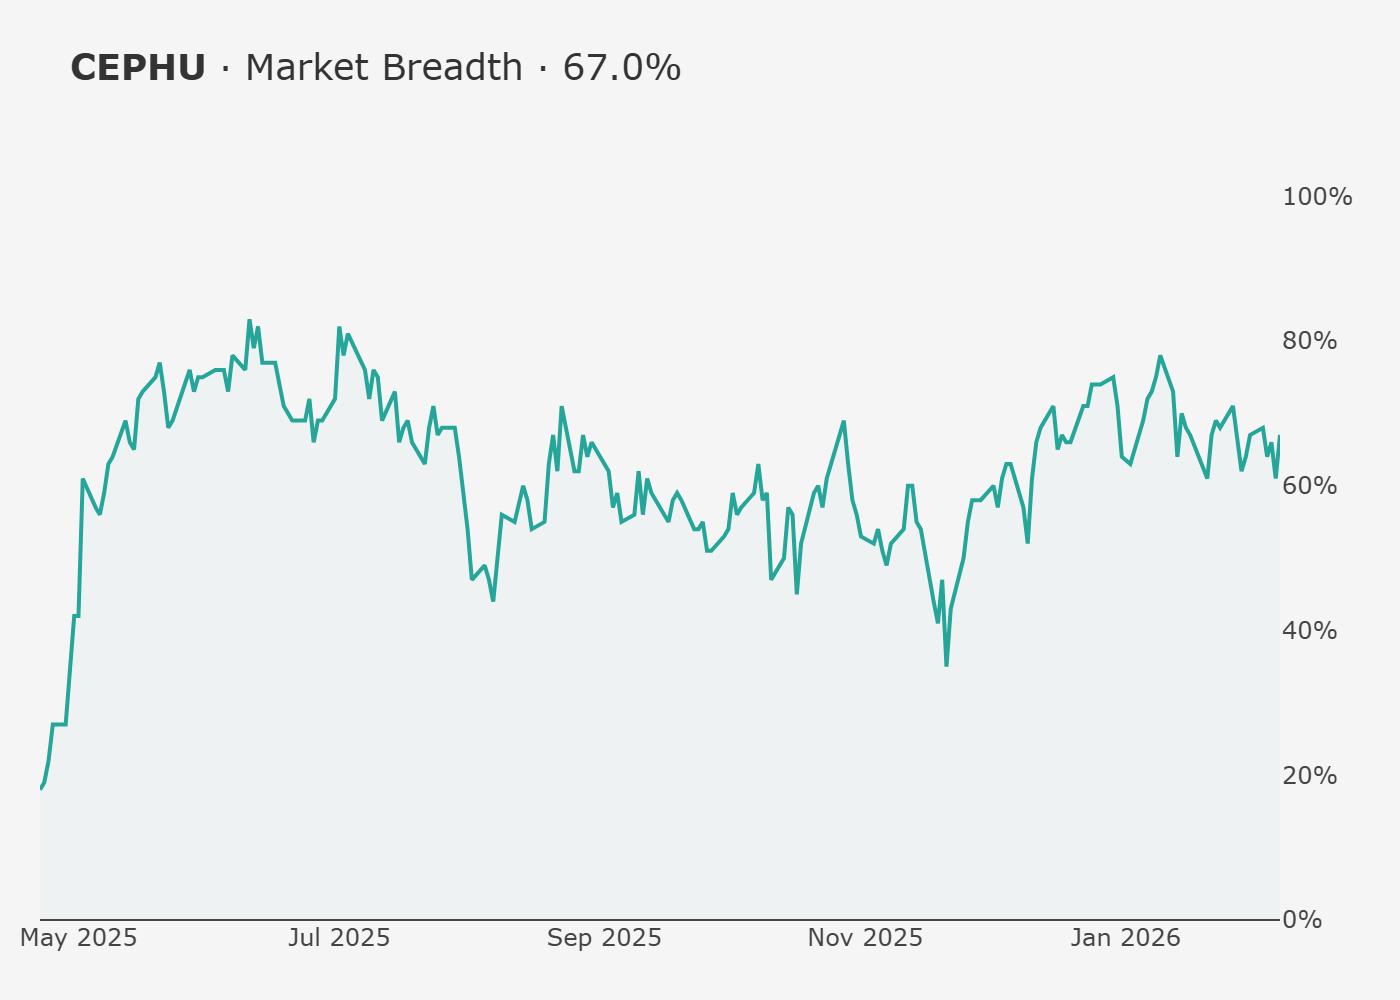
Market Breadth
A reading of 67% indicates that more than two-thirds of the S&P 500's most influential companies are currently trading above their 50-day moving average. From a quantitative perspective, this is a strong bullish signal. It confirms that the current market trend is not just driven by a handful of tech giants, but is supported by a broad base of institutional "heavyweights."
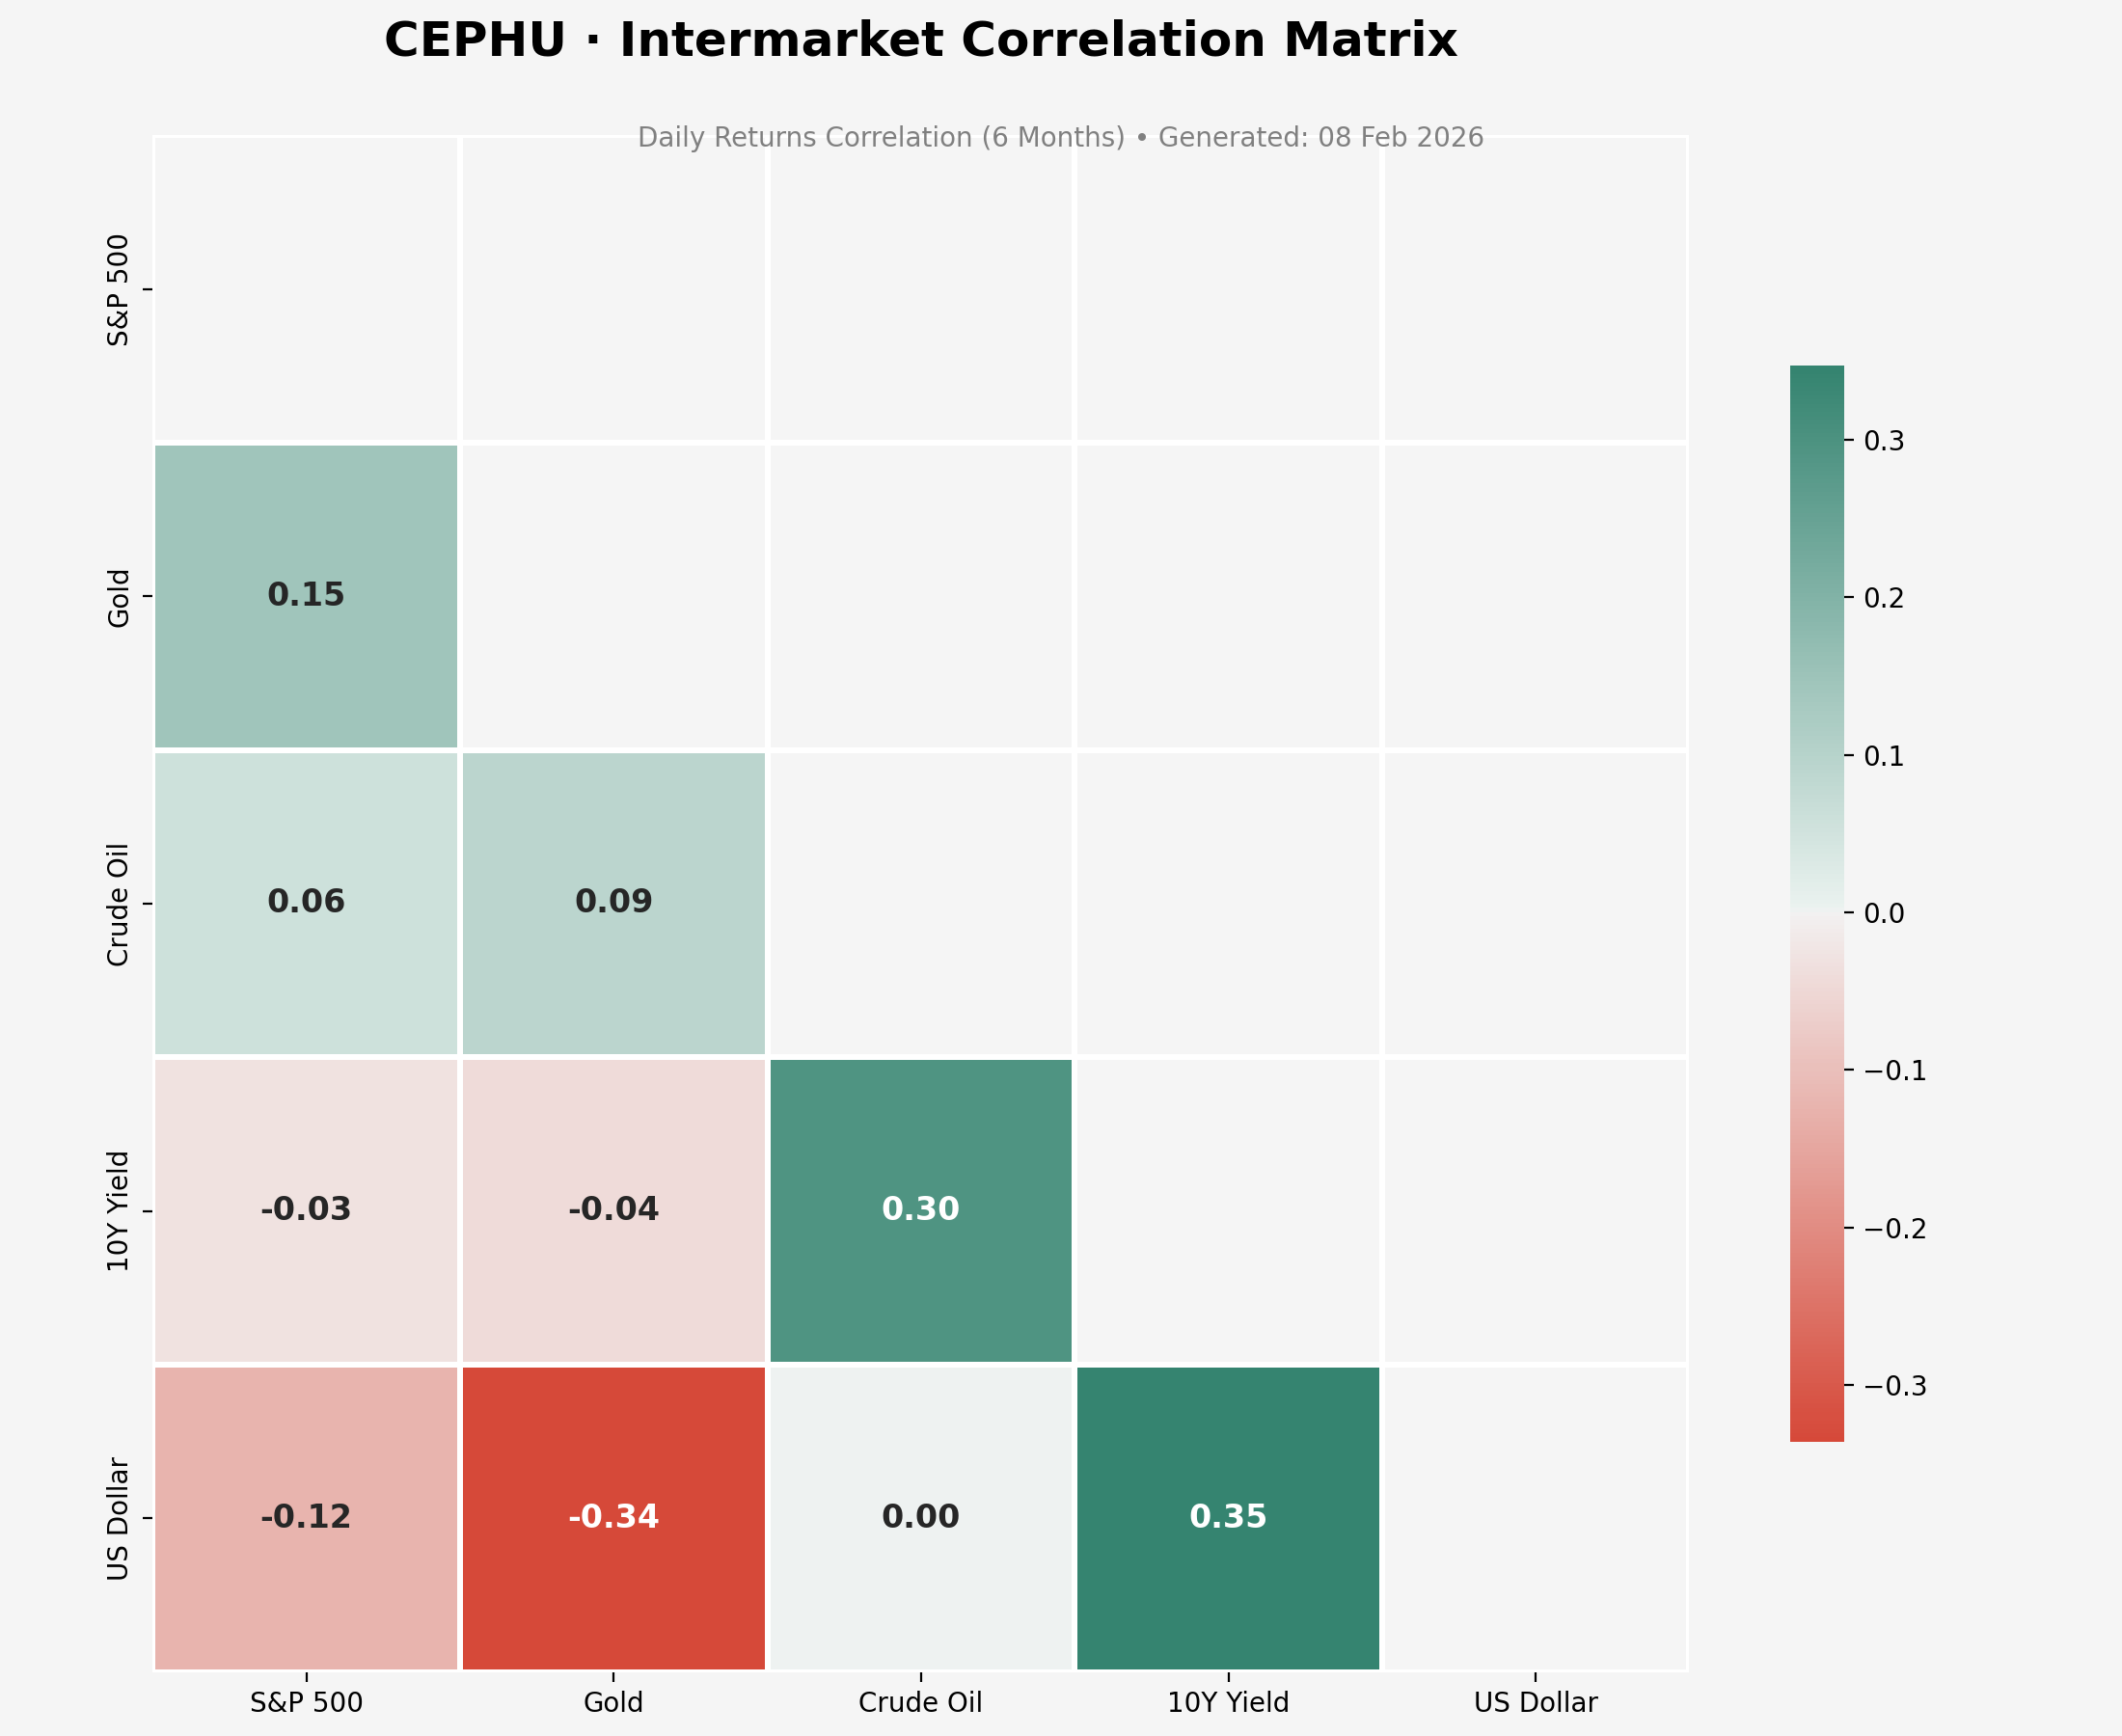
Intermarket Correlation Analysis
Market Regime: Macro-Driven Sensitivity
The current correlation matrix reveals a strong positive link (+0.35) between the US Dollar and 10Y Yields, suggesting that capital flows are tightly coupled with interest rate expectations. For the S&P 500, the negative correlation with the US Dollar (-0.12) indicates that a strengthening greenback remains a persistent headwind for equities.
Most notably, the Gold-to-Dollar correlation (-0.34) is the strongest inverse relationship on the board, confirming that Gold is currently trading as a pure currency hedge rather than an independent safe haven. Traders should exercise caution: as long as these macro correlations remain elevated, individual stock selection will likely be overshadowed by broad index moves driven by Treasury volatility.
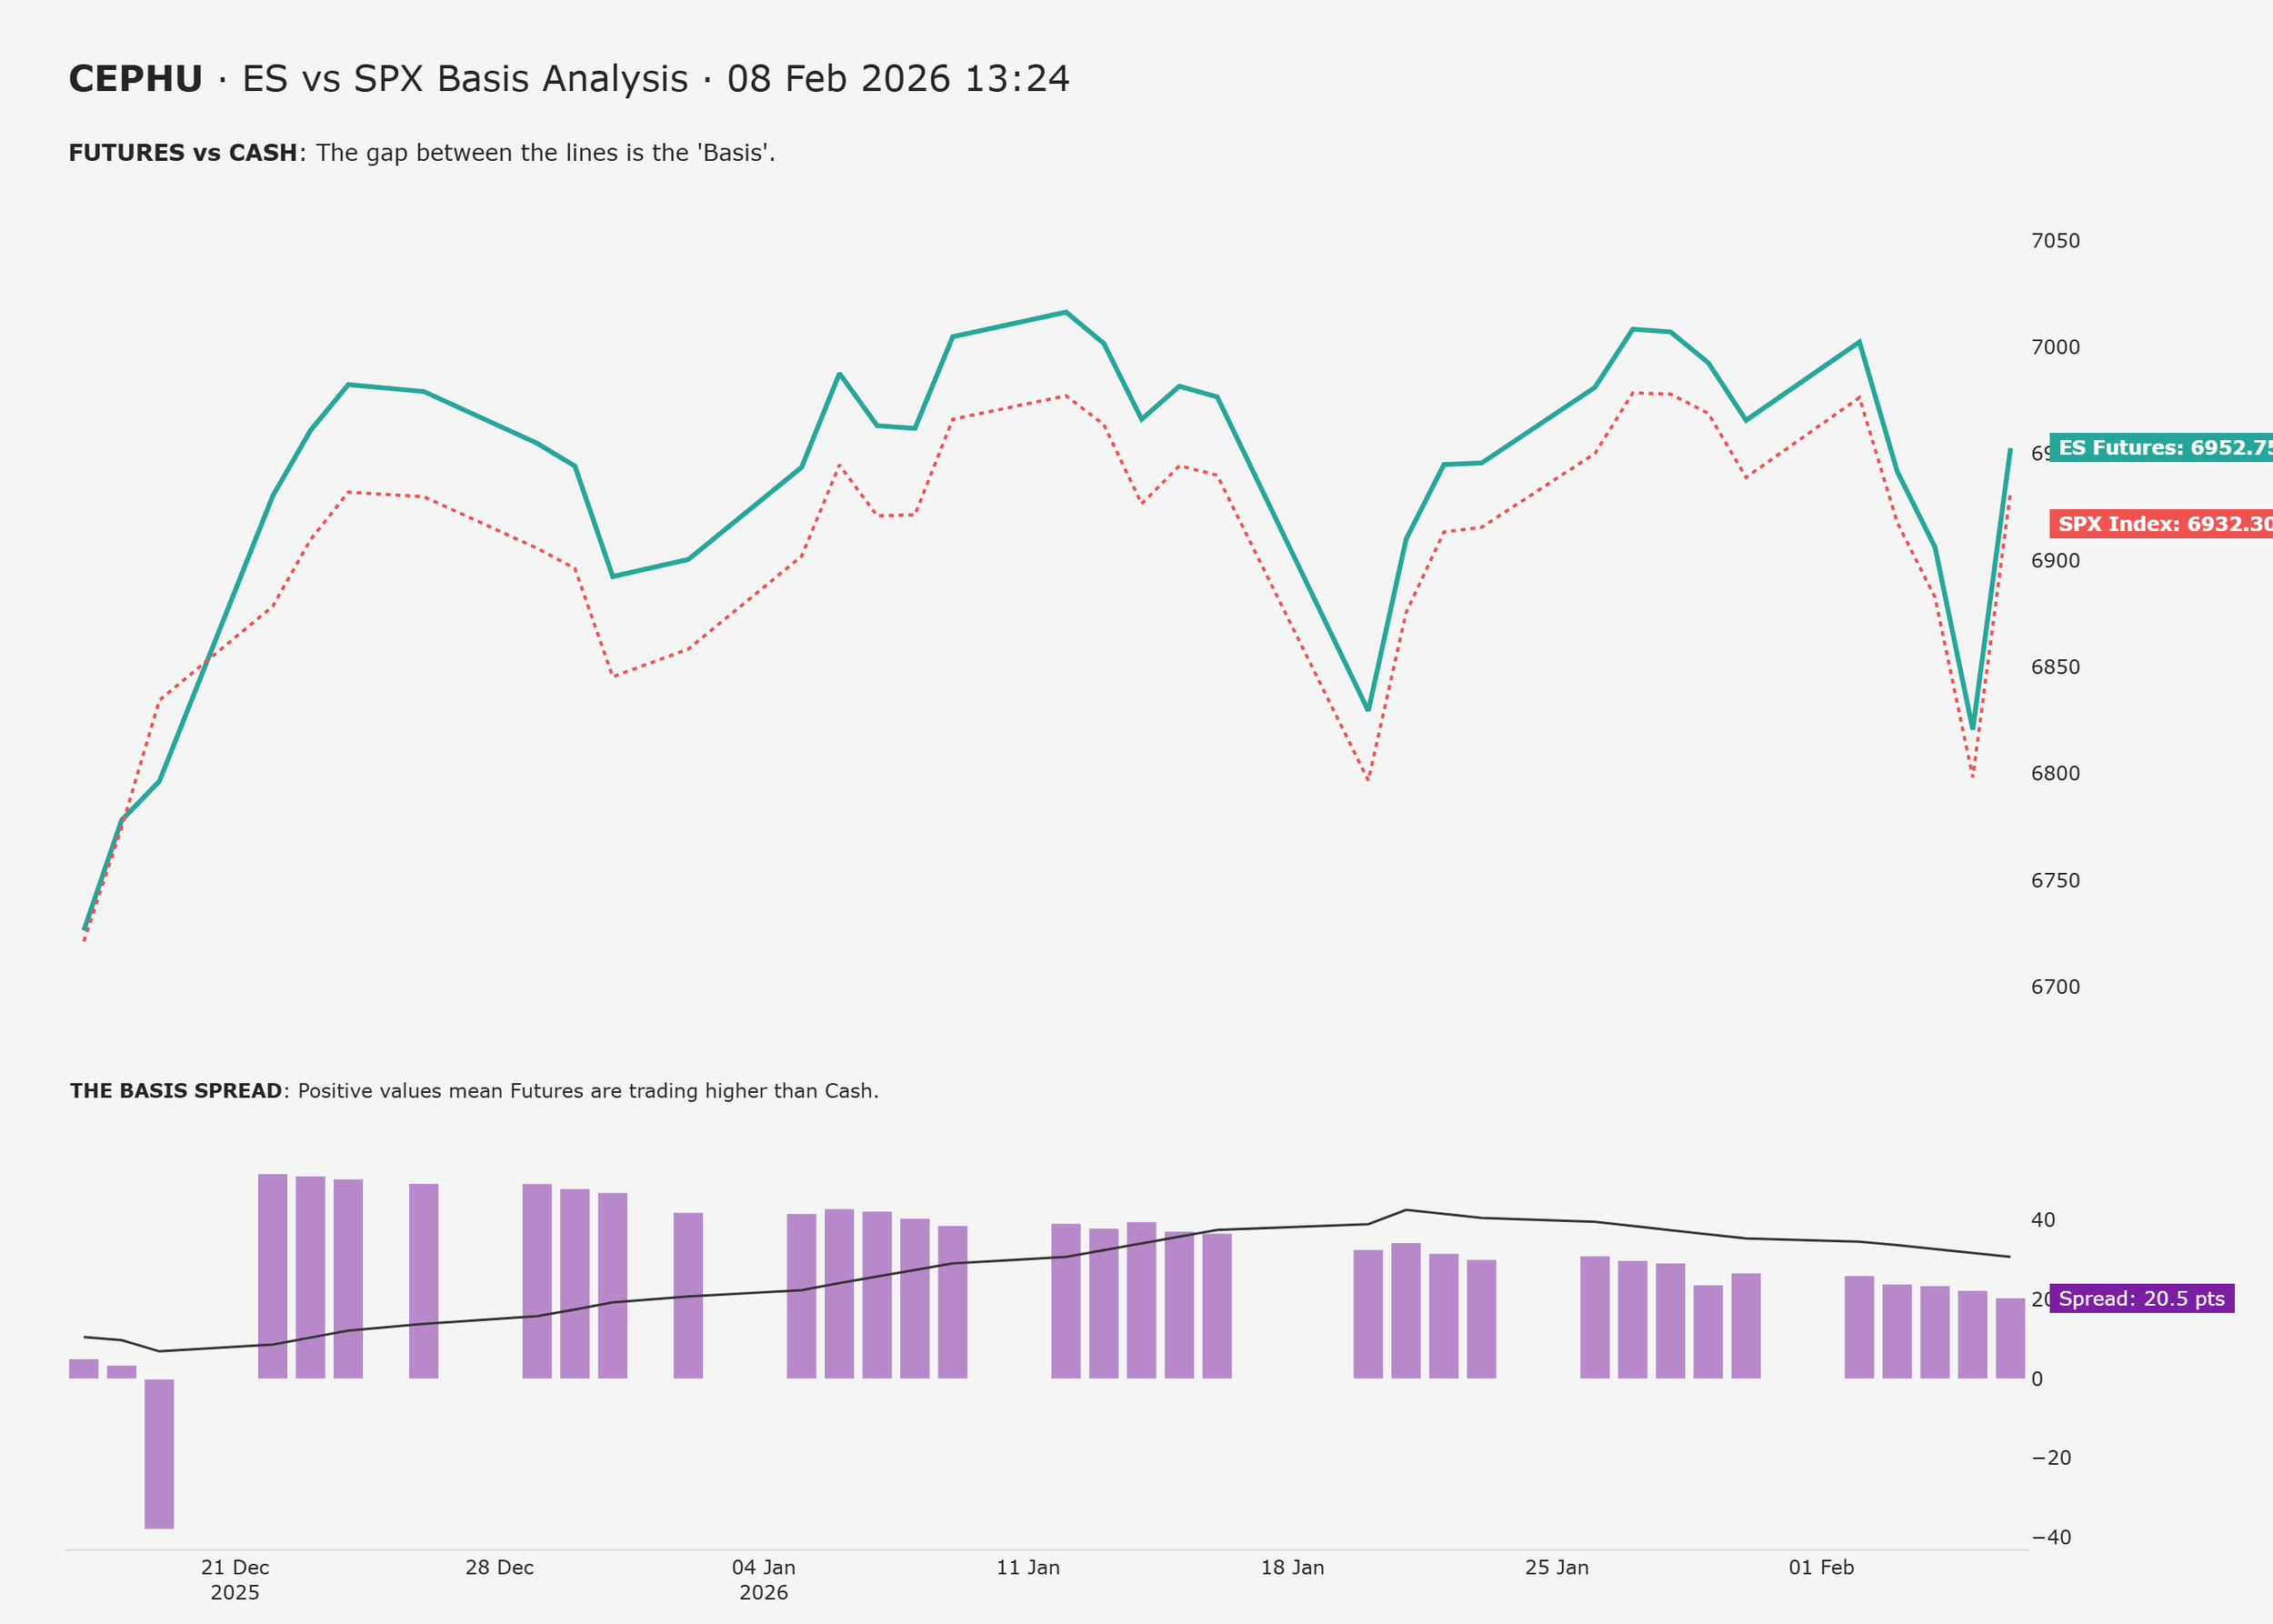
ES vs SPX Basis Analysis
A positive basis of 20.45 points confirms a healthy "Contango" structure. This means the market is pricing in standard interest and dividend expectations without signs of speculative fever or institutional panic. The trend remains statistically stable.
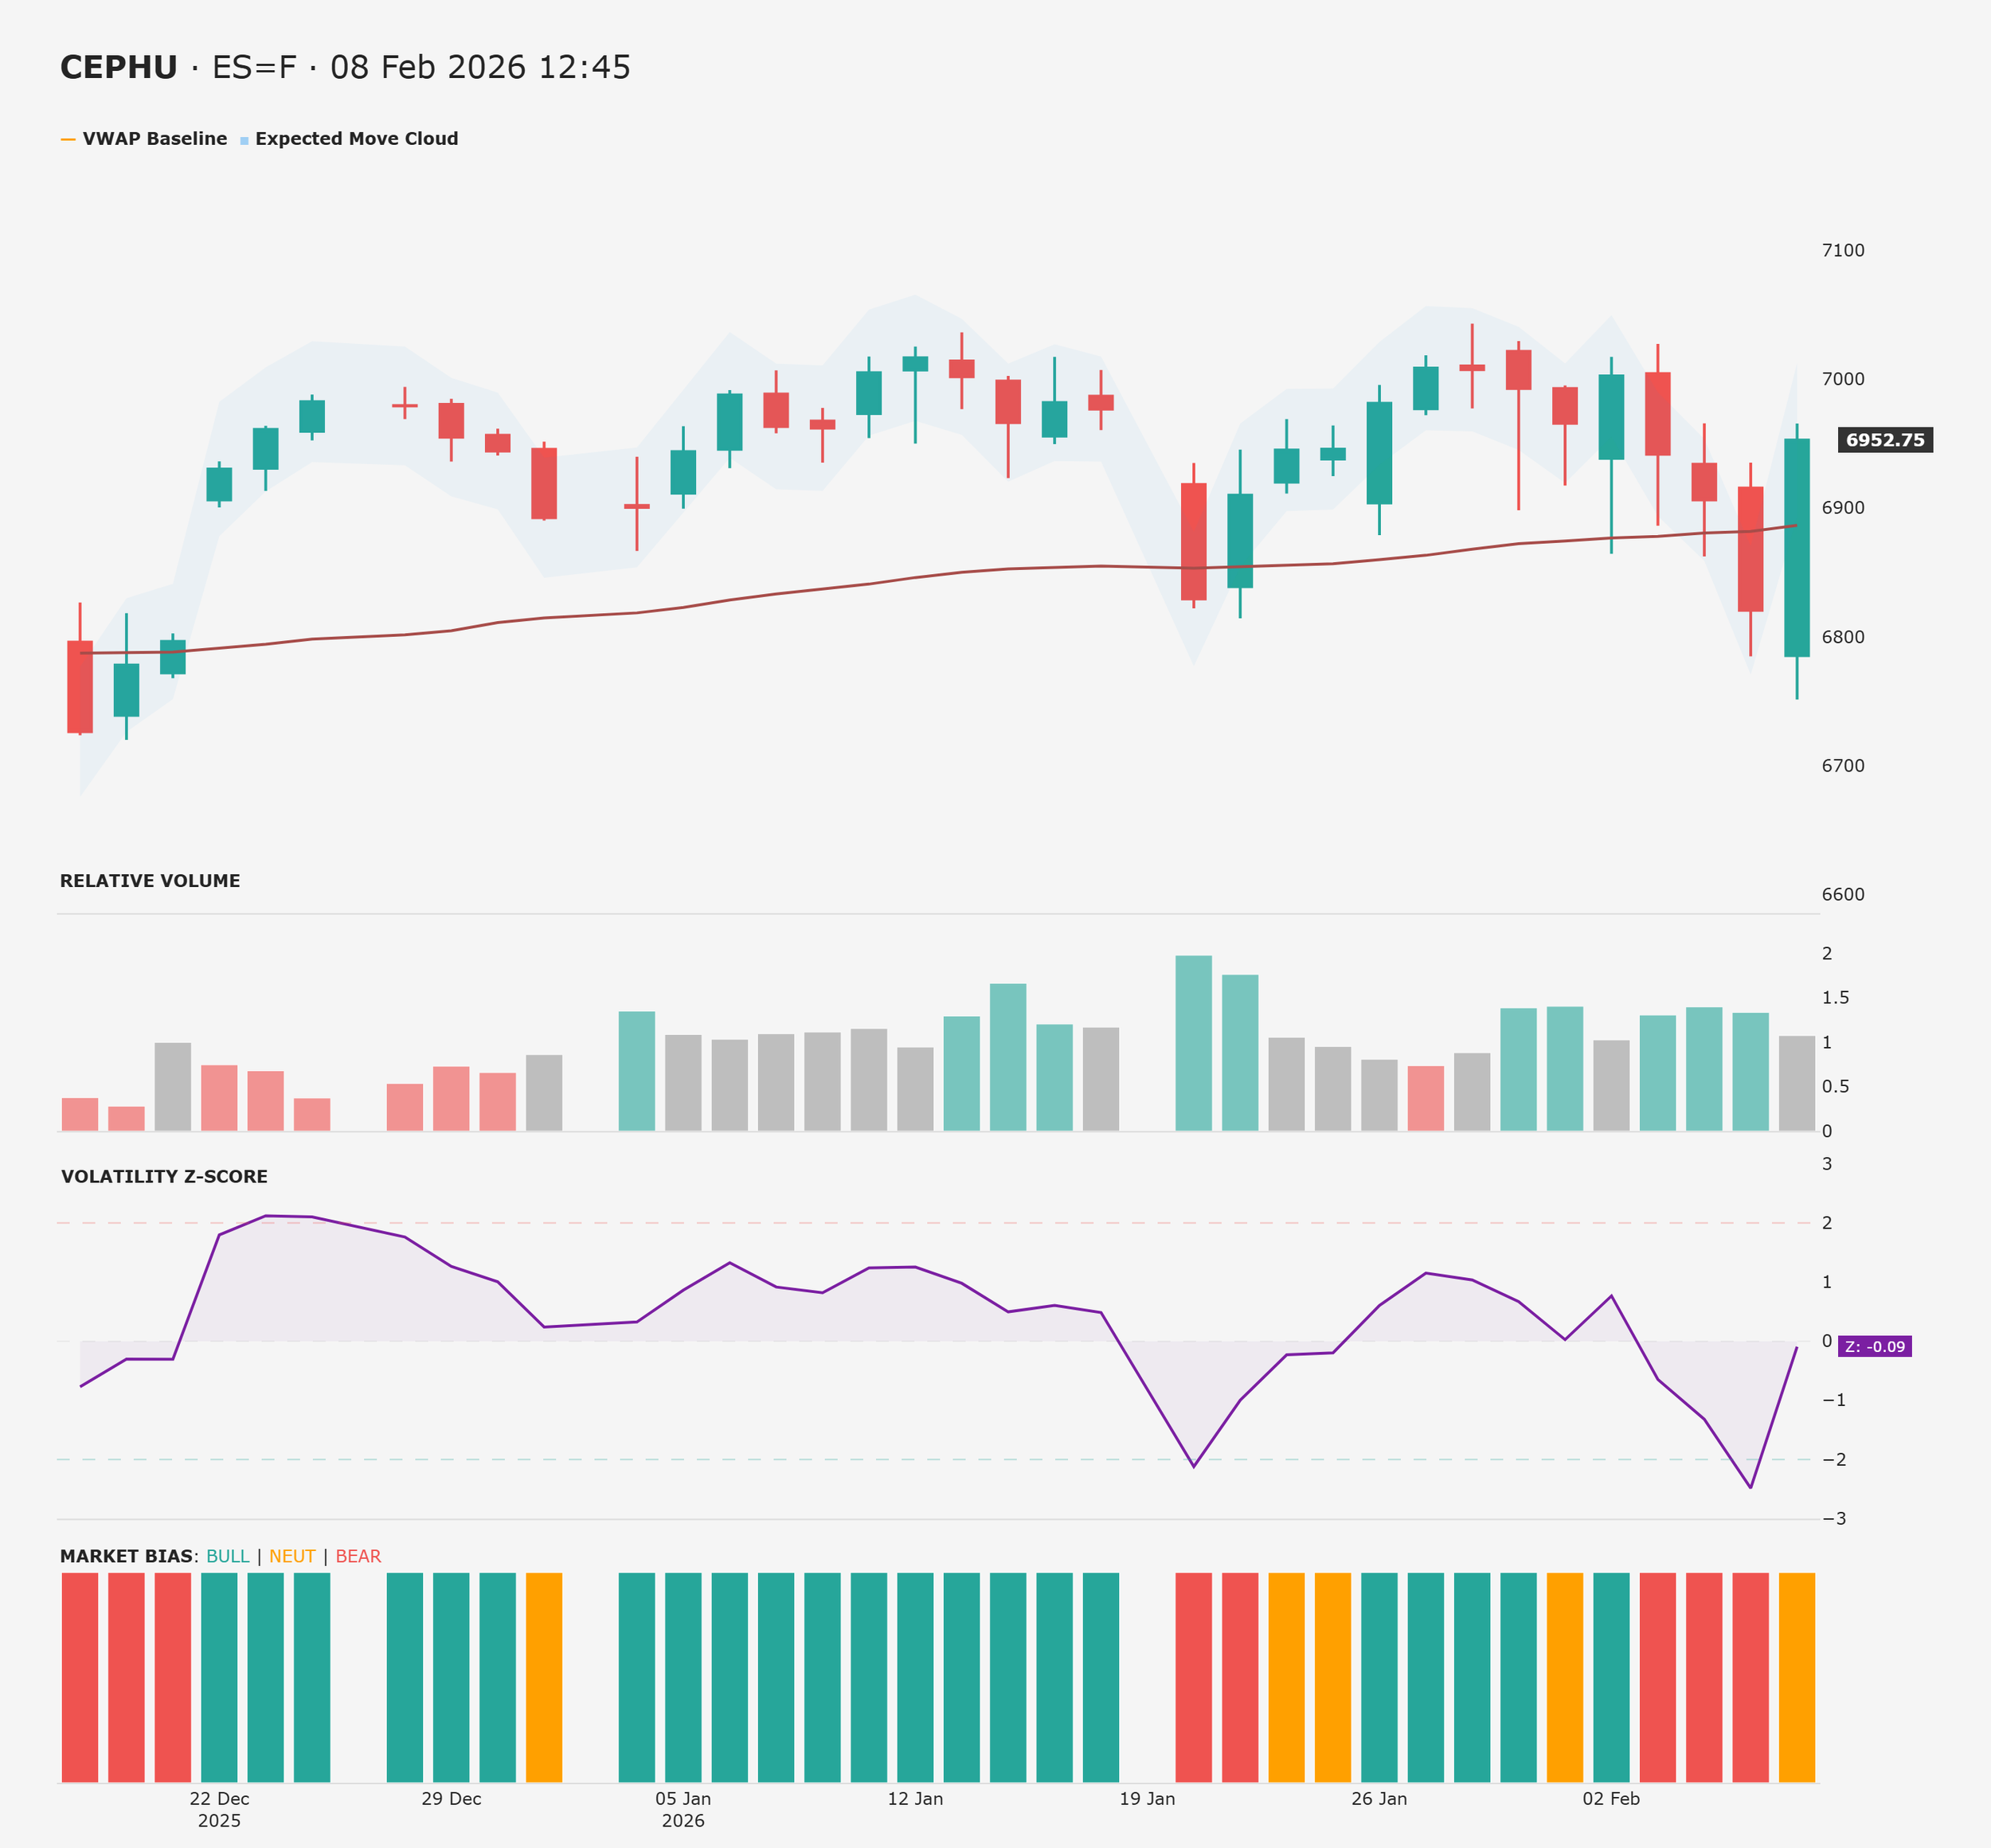
ES Futures Breakdown
Professional Quant analysis of the ES Futures: merging institutional VWAP baselines with statistical Expected Move projections. Discover why the S&P 500 is currently trading within its normal range and what the Z-Score reveals about the next move. Pure data, 100% ad-free.
Get in Touch
Do you have a specific ticker on your watchlist that requires a deeper look? Whether it’s an individual stock, a commodity, or a niche index, I can apply the Cephu Multi-Lens Methodology to your request.
Simply fill out the form. I prioritize requests from our active community members and supporters. Use this tool to cut through the noise with data-driven precision.