Intermarket Correlation Analysis
In modern markets, no asset class moves in isolation. For a Quantitative Trader, understanding the mathematical "links" between equities, commodities, and macro drivers is essential for identifying regime shifts. This matrix visualizes the correlation of daily returns over the past 6 months, stripping away the noise to reveal the underlying market structure.
How to Read This Map
The Scale: Values range from +1.00 (perfectly synchronized movement) to -1.00 (perfectly inverse movement).
The Colors: Deep green indicates assets that trend together, while deep red highlights a strong inverse relationship.
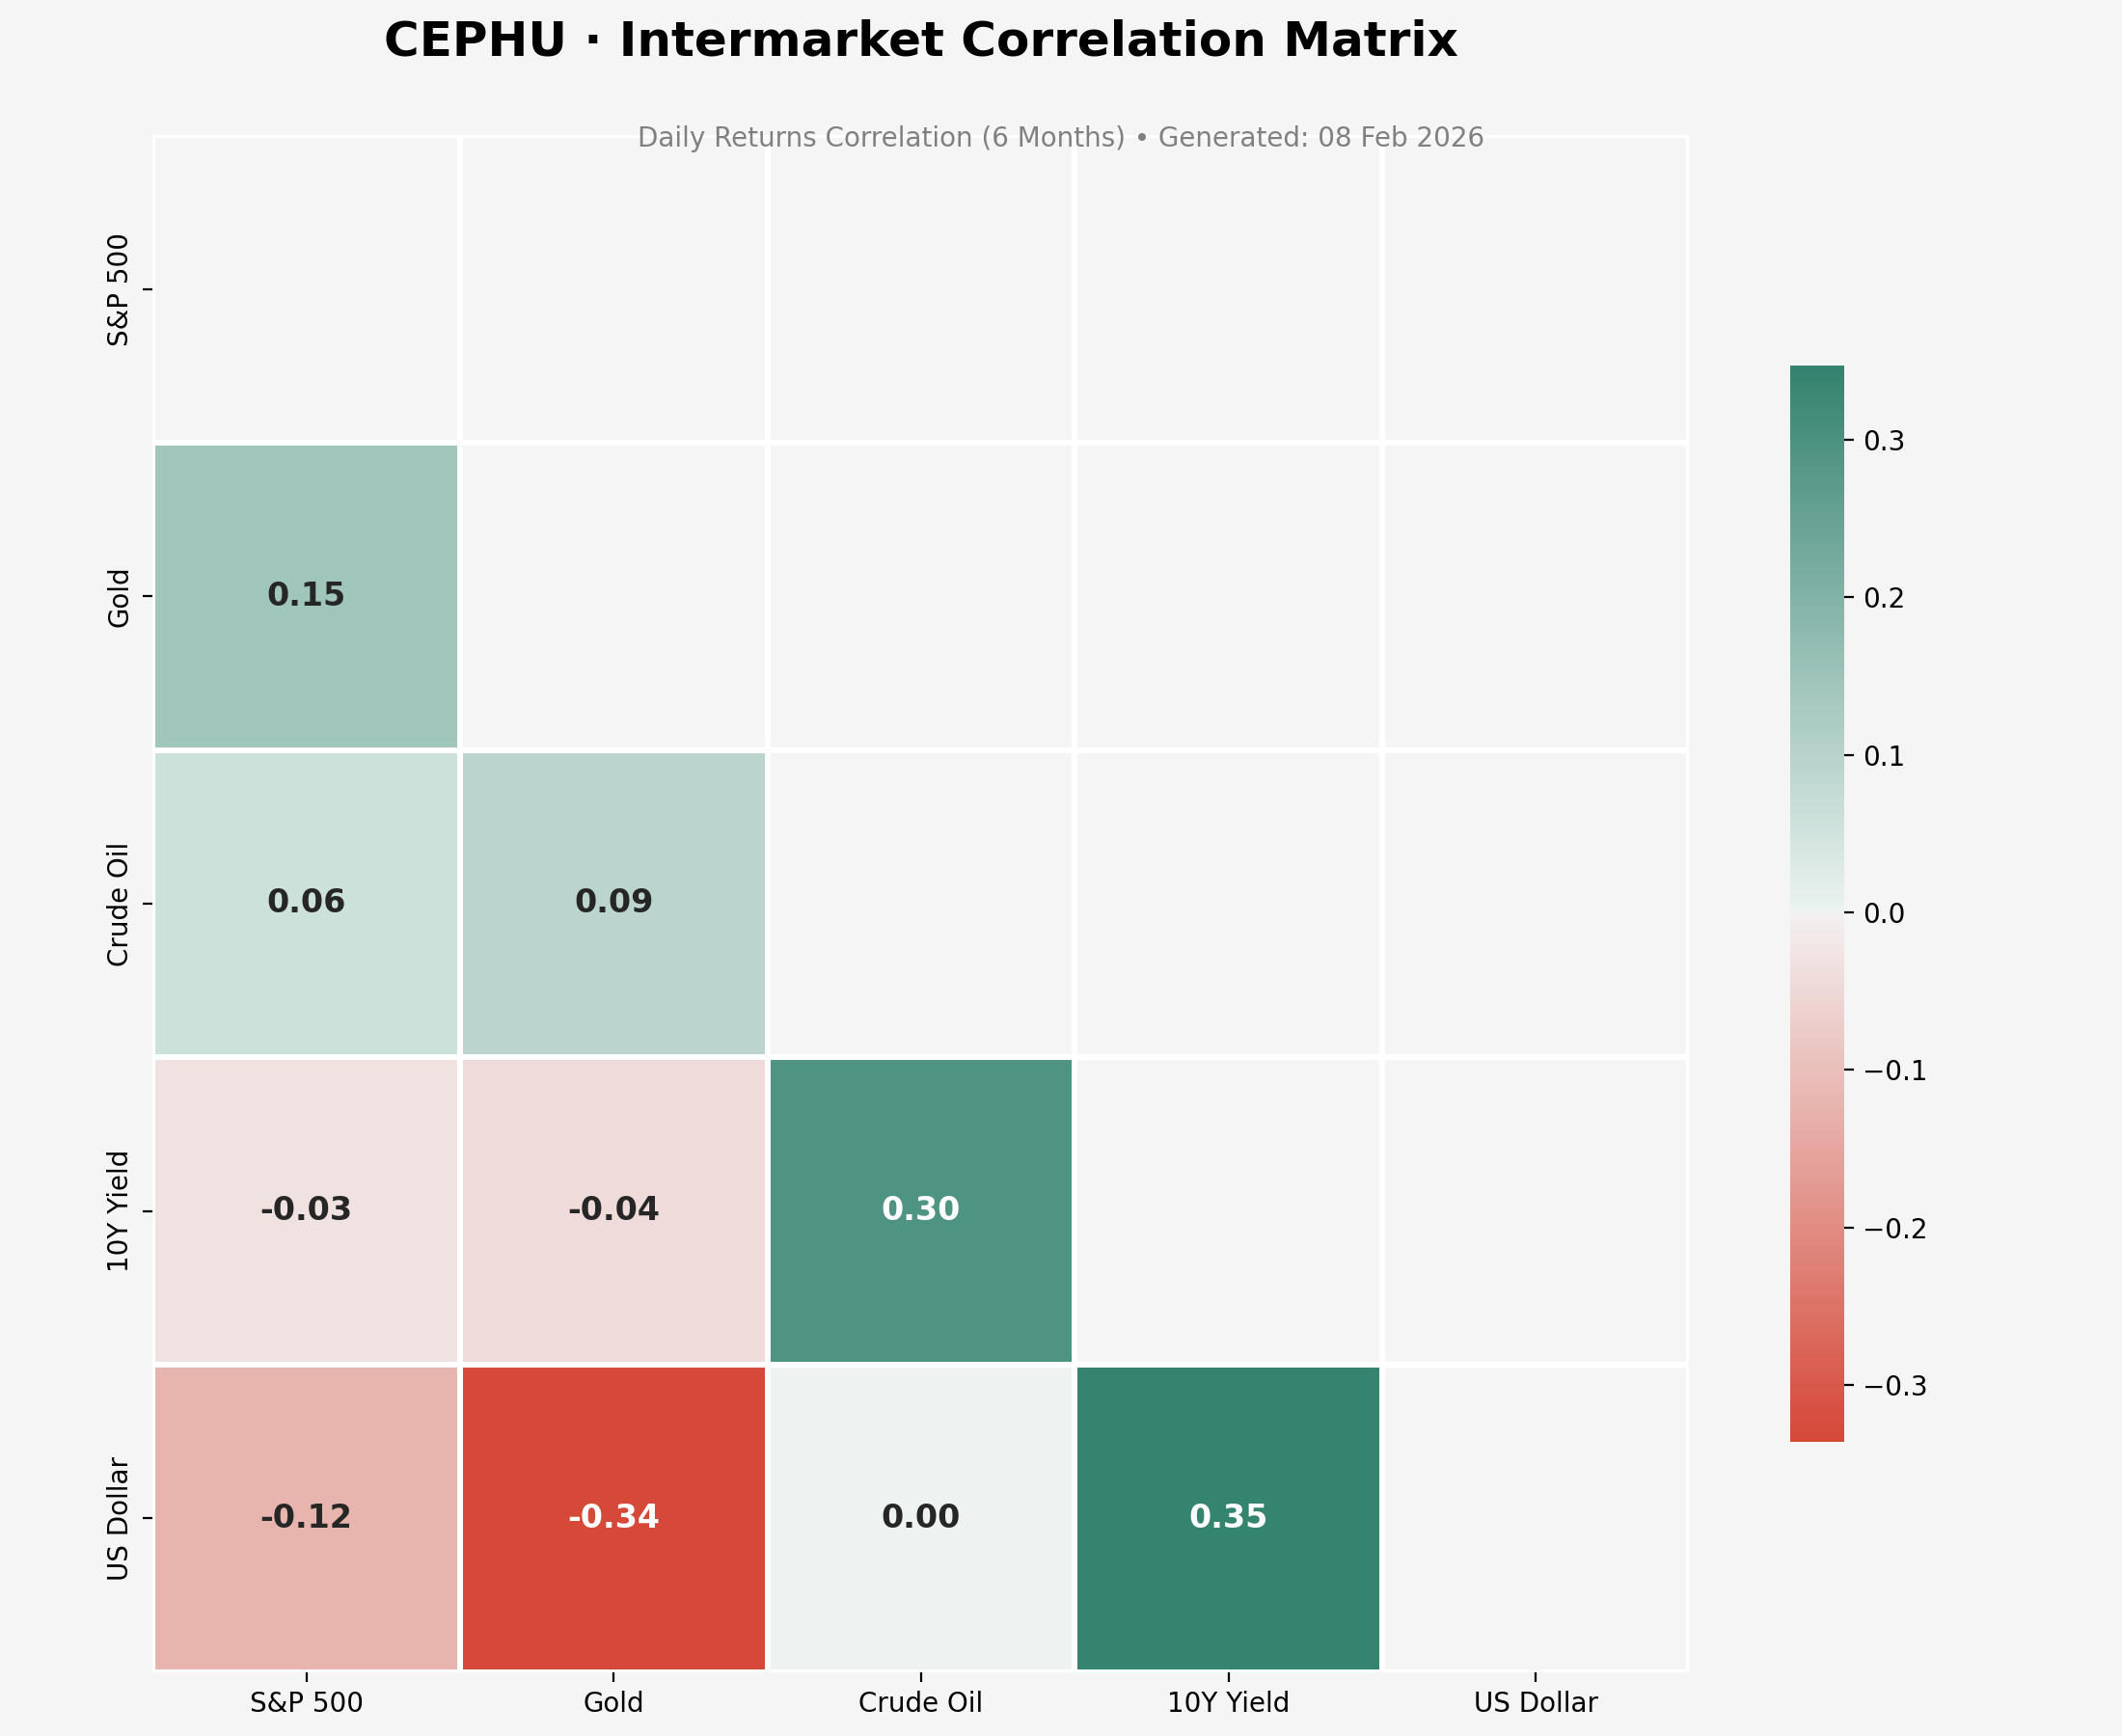
The White Space: To ensure maximum clarity, we use an Upper Triangle Mask. Since the correlation between Gold and the S&P 500 is identical to the correlation between the S&P 500 and Gold, we display the data once to focus on the core insights.
Key Institutional Markers
Equity & Yield Sensitivity: Watch the relationship between the S&P 500 and the 10Y Yield. A negative correlation often suggests that rising rates are a headwind for stocks, while a positive correlation can signal a robust, growth-driven environment.
The Dollar Barometer: The US Dollar (UUP) often serves as a global liquidity gauge. Strong negative correlations between the Dollar and Equities typically indicate a "Risk-Off" environment where capital is fleeing to the safety of cash.
Safe Haven Dynamics: By monitoring Gold's correlation with the S&P 500, we can determine if the precious metal is acting as a true hedge or simply trading as another "Risk-On" asset.
The Current Verdict
Market Regime: Macro-Driven Sensitivity
The current correlation matrix reveals a strong positive link (+0.35) between the US Dollar and 10Y Yields, suggesting that capital flows are tightly coupled with interest rate expectations. For the S&P 500, the negative correlation with the US Dollar (-0.12) indicates that a strengthening greenback remains a persistent headwind for equities.
Most notably, the Gold-to-Dollar correlation (-0.34) is the strongest inverse relationship on the board, confirming that Gold is currently trading as a pure currency hedge rather than an independent safe haven. Traders should exercise caution: as long as these macro correlations remain elevated, individual stock selection will likely be overshadowed by broad index moves driven by Treasury volatility.
Support My Work
Cephu is a platform built on precision, transparency, and independence. I provide these daily Quant breakdowns and on-demand analyses 100% ad-free and free to access.
Maintaining these models and providing high-quality data requires significant time and resources. If my work helps you stay focused and informed in the markets, consider supporting the project. Your contributions keep the platform running and the insights flowing.
Support the Creator / Donate Here