Daily TA - AEX
Trend & Structure (SMA Analysis)
Primary trend:
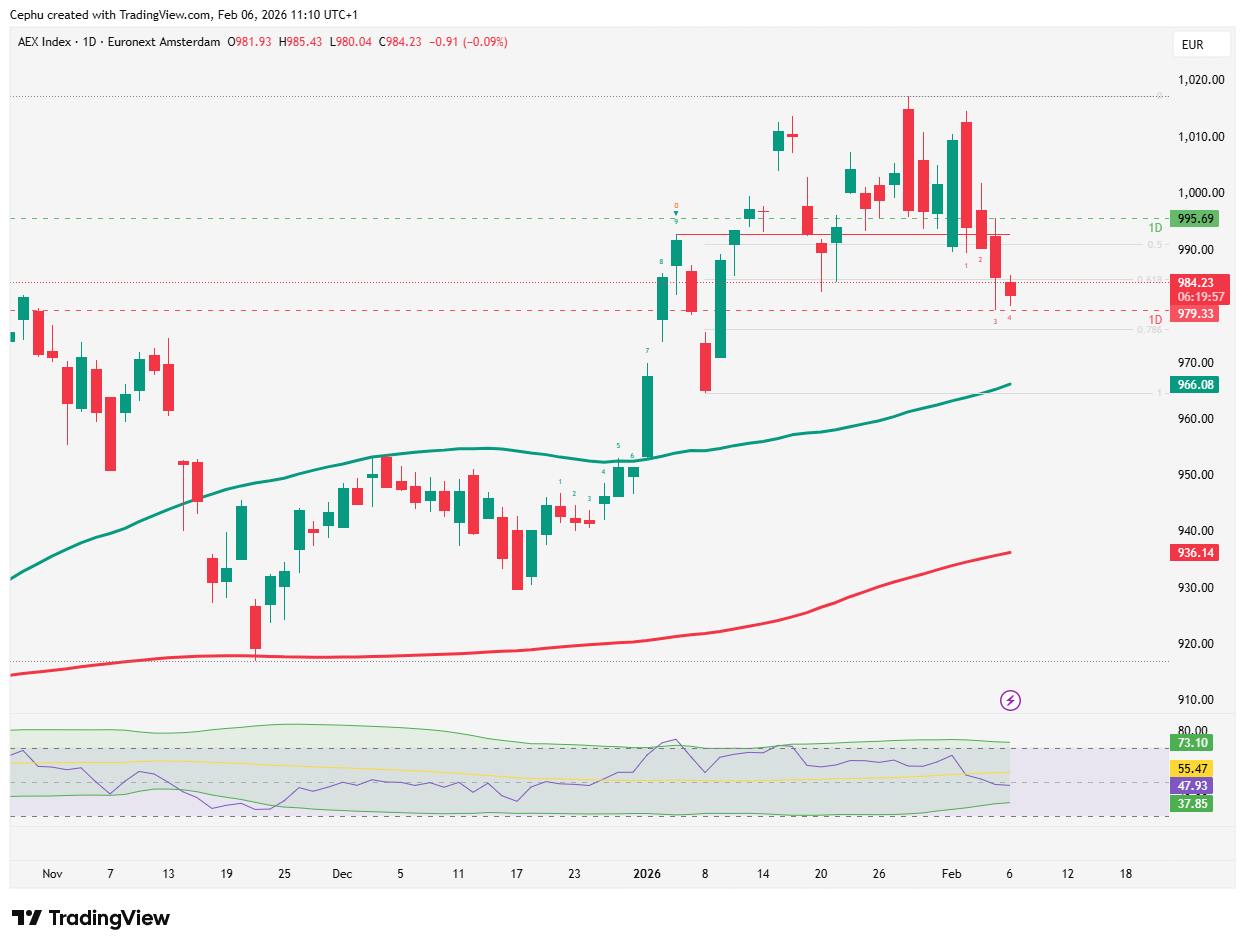
Price trades well above the SMA200, keeping the primary trend bullish despite the current pullback.
Intermediate trend:
SMA55 is rising, but price has dipped below it, signaling weakening structure in the intermediate trend.
This often suggests consolidation or a corrective phase within a broader uptrend.Short-term trend:
Short-term structure is bearish-biased as the AEX continues to print lower highs and retests support zones.
Key takeaway:
“As long as price remains above the SMA 55 and 200, the trend bias stays bullish.”
Swing Sequencer
Current swing count: 4
Today’s signal: red candle with red Swing Count
Interpretation: The chart shows a continuation of the corrective phase, consistent with the red candle structure. Price is losing upward swing momentum, aligning with a downswing sequence.
Key takeaway:
“A renewed downswing is likely underway unless upward price action reclaims the prior support turned resistance.”
Momentum (RSI)
RSI value: 47.93
Zone: neutral, no oversold signal yet
Behavior: drifting lower
Interpretations:
weakening momentum
sellers gaining short-term control
no oversold signal yet
room for continuation of the correction
Key takeaway:
“RSI at 47.93 is not showing bullish divergence at this stage.”
Key Levels to Watch
Support:
S1: 965
S2: 950
Resistance:
R1: 1015
R2: 1030
Key takeaway:
“A break bellow 975 opens the door toward SMA55 at 965.”
Outlook for the Next Trading Day
If the AEX holds above 975, a short‑term bounce is possible.
However:
A close below 975 opens the path toward 965,
and a deeper correction toward the mid‑940 zone remains possible if momentum weakens further.
Upside requires a break back above 985, which would signal buyers regaining control.
Support My Work
If you appreciate these clear, structured daily analyses, you can support the work via the donation page. Your contribution keeps Cephu independent and ad‑free.