Daily TA - NVDA
Trend & Structure (SMA Analysis)
Primary trend:
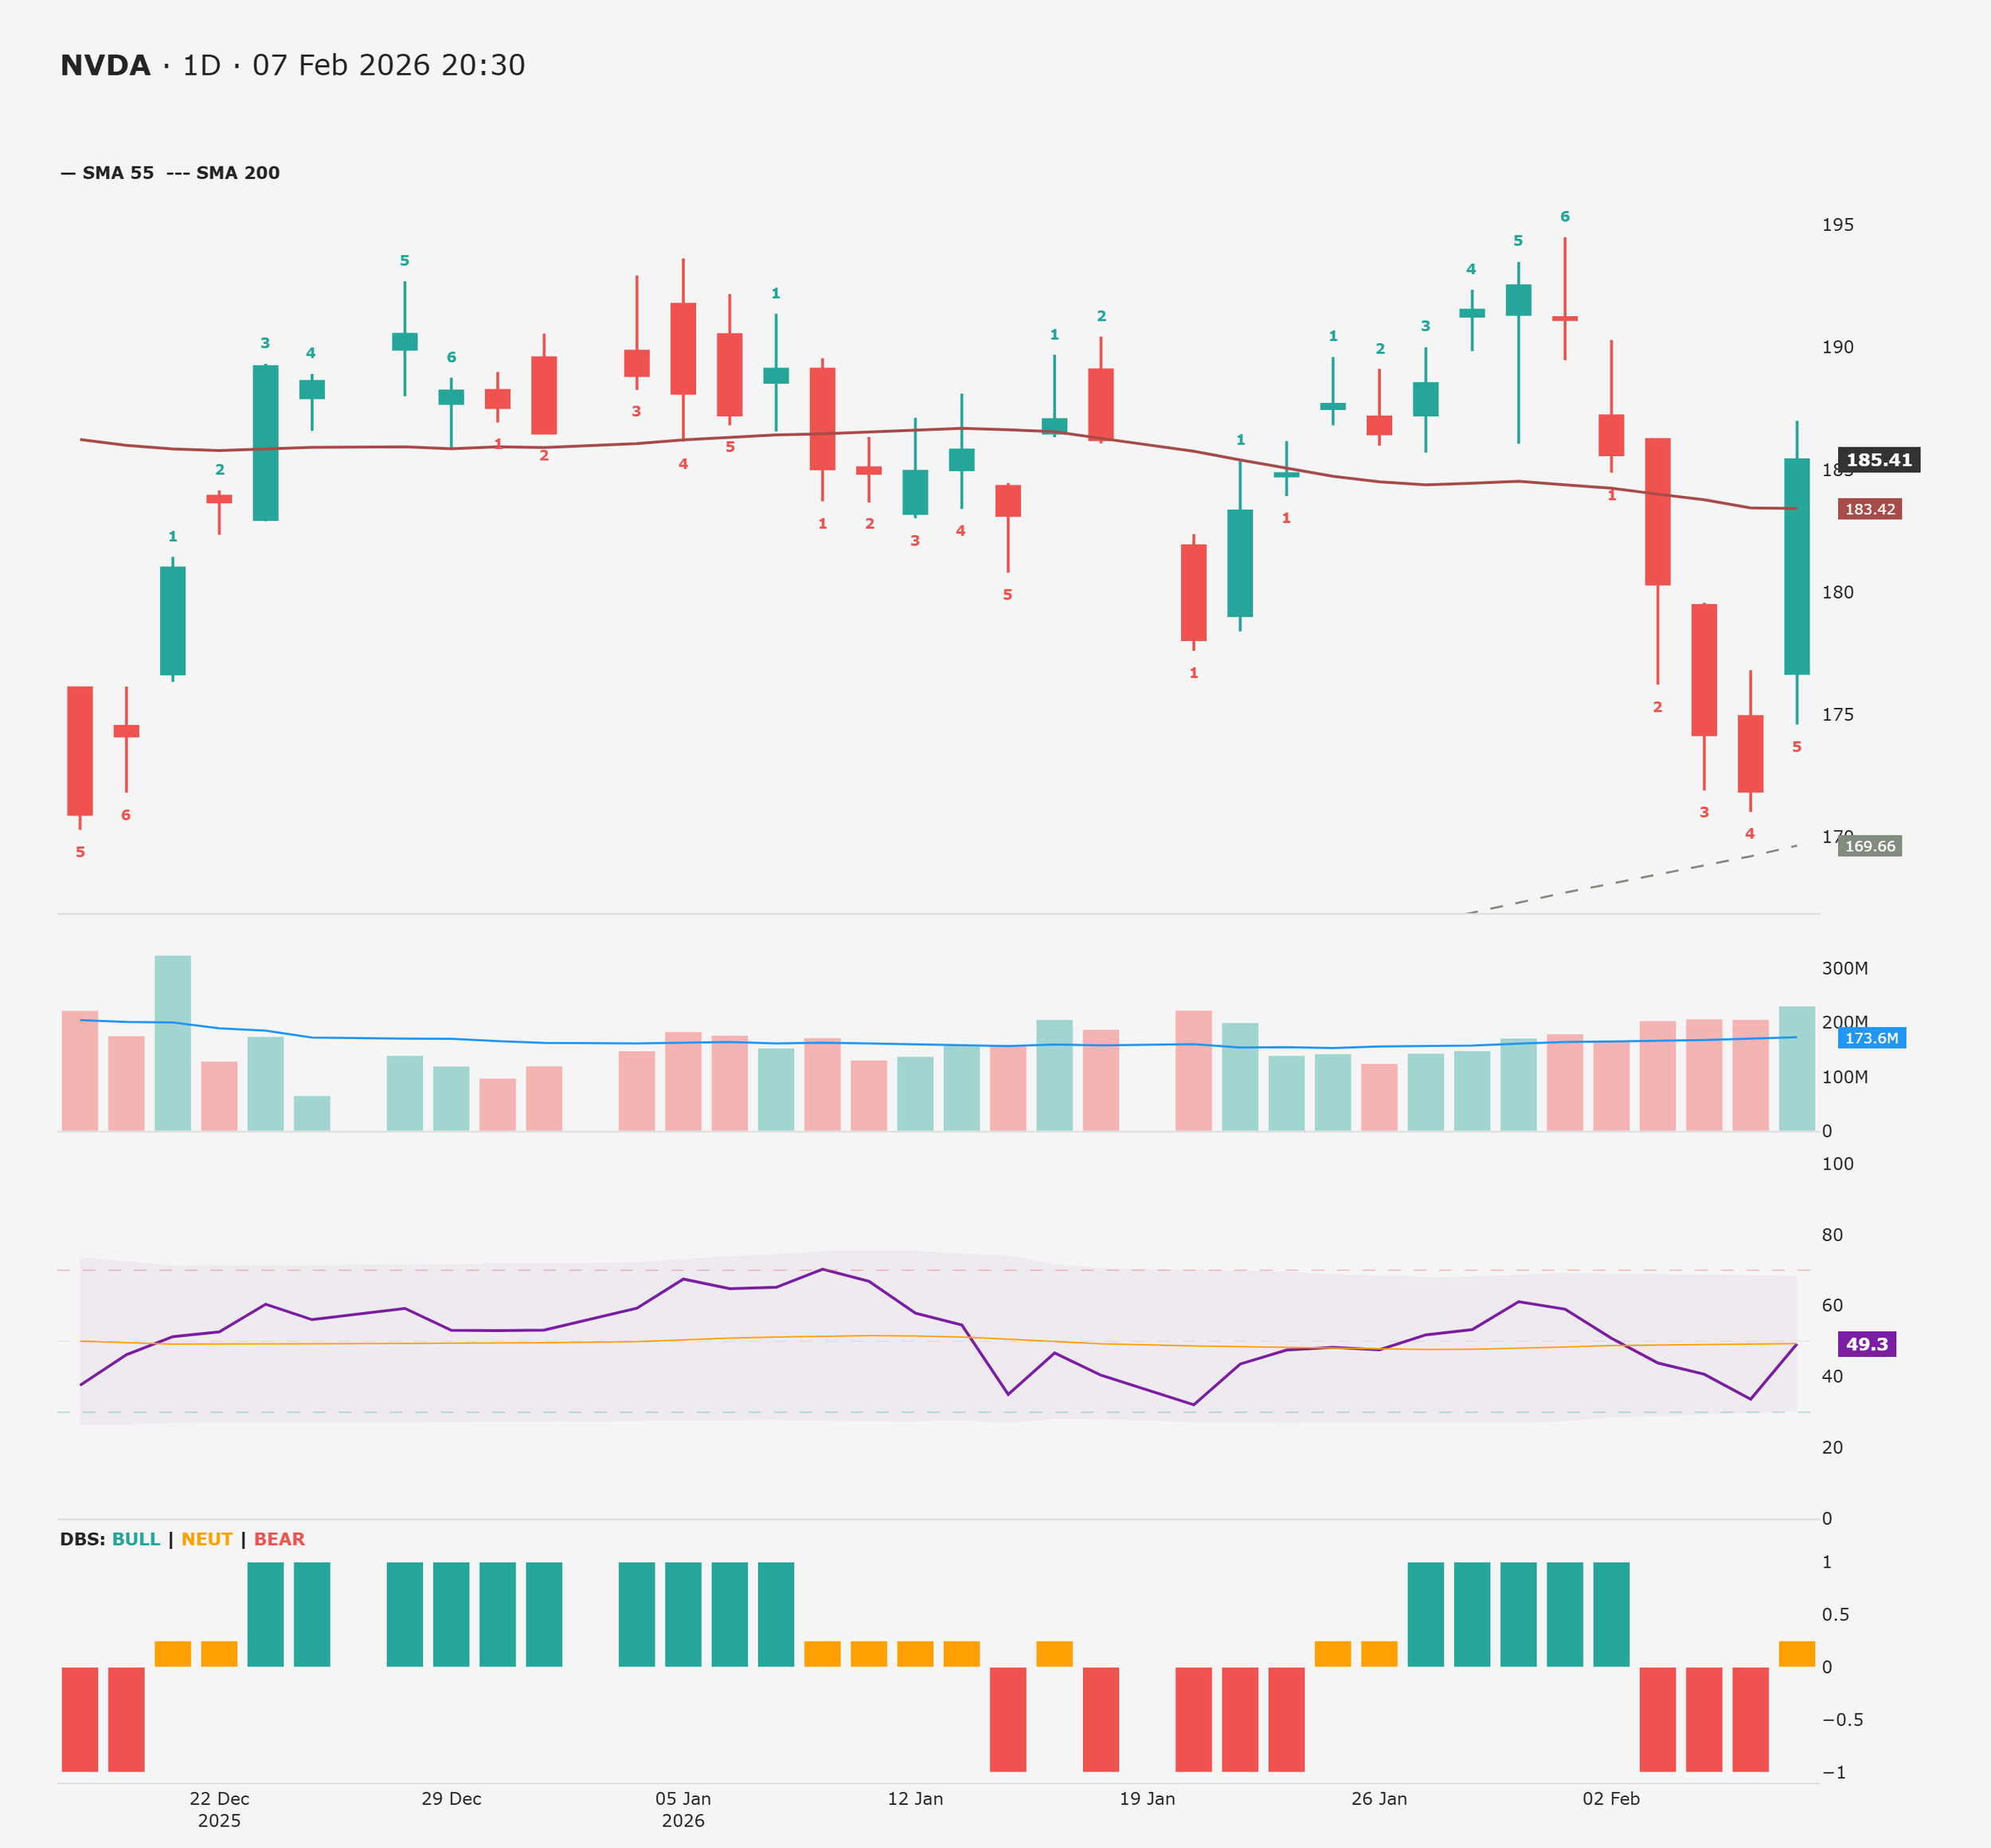
Price action remains comfortably above the SMA200 (dashed line), keeping the primary long-term trend firmly Bullish.
Intermediate trend:
The SMA55 (solid brown line) is currently flattening. Price has recently dipped to test this level, signaling a weakening intermediate structure and suggesting we are in a corrective or consolidation phase.Short-term trend:
The short-term bias is Bearish. NVDA is printing lower highs and struggling to maintain footing above recent support levels near the SMA55.
Key takeaway:
“As long as price remains above the SMA200 and holds the SMA55 area, the macro bias stays bullish, but the immediate path of least resistance remains sideways-to-down.”
Swing Sequencer
Current swing count: 5 (Bearish/Red)
Today’s signal: A continuation of the red count following an earlier rejection at local resistance.
Interpretation: With a count of 5, the downswing is gaining maturity but has not yet reached exhaustion (typically near count 9). Price is losing upward momentum, aligning with a structured downward sequence.
Key takeaway:
“A renewed downswing is underway; a reclaim of the prior local high (start of count 1) is required to invalidate this bearish sequence.”
Momentum (RSI)
RSI value: 49.3
Zone: Neutral (hovering just below the 50-midpoint)
Behavior: Drifting lower within the Bollinger Band smoothing cloud
Interpretations:
Momentum is fading as the RSI remains pinned below the 50-centerline.
Sellers are currently in control of the short-term tape.
There is no oversold signal yet (RSI is far from the 30-level), suggesting there is still technical "room" for the price to drop further before a bounce is due.
Key takeaway:
“RSI at 49.3 confirms neutral-to-bearish momentum with no signs of bullish divergence at this stage.”
DBS Indicator (Trend Bias)
Status: NEUTRAL (Orange).
Interpretation: The DBS bar has transitioned from Red (Bear) to Orange (Neutral). This indicates that while aggressive selling pressure has paused, buyers have not yet reclaimed control to shift the trend back to Green (Bull).
Key Takeaway:
“The DBS confirms a 'wait-and-see' approach; we are looking for a return to green bars to signal a high-probability entry.”
Key Levels to Watch
Support:
S1: 183.42 (Current SMA55 level)
S2: 170.00 (Psychological level and SMA200 zone)
Resistance:
R1: 190.00 (Recent peak / Sequencer origin)
R2: 195.00
Key takeaway:
“A sustained daily close below the SMA55 at 183.42 opens the door directly toward the SMA200 zone near 170.”
Outlook for the Next Trading Day
If NVDA can stabilize above 183, we may see further consolidation. However, the technical weight remains heavy in the short term.
Bearish Case: A close below 183 confirms a move toward the 170 (SMA200) zone.
Bullish Case: Buyers must reclaim 190 on volume to signal that this correction has bottomed and that the primary uptrend is ready to resume.
Support My Work
If you appreciate these clear, structured daily analyses, you can support the work via the donation page. Your contribution keeps Cephu independent and ad‑free.