Daily TA - AEX
Profiting from Panic – A Mean Reversion Study
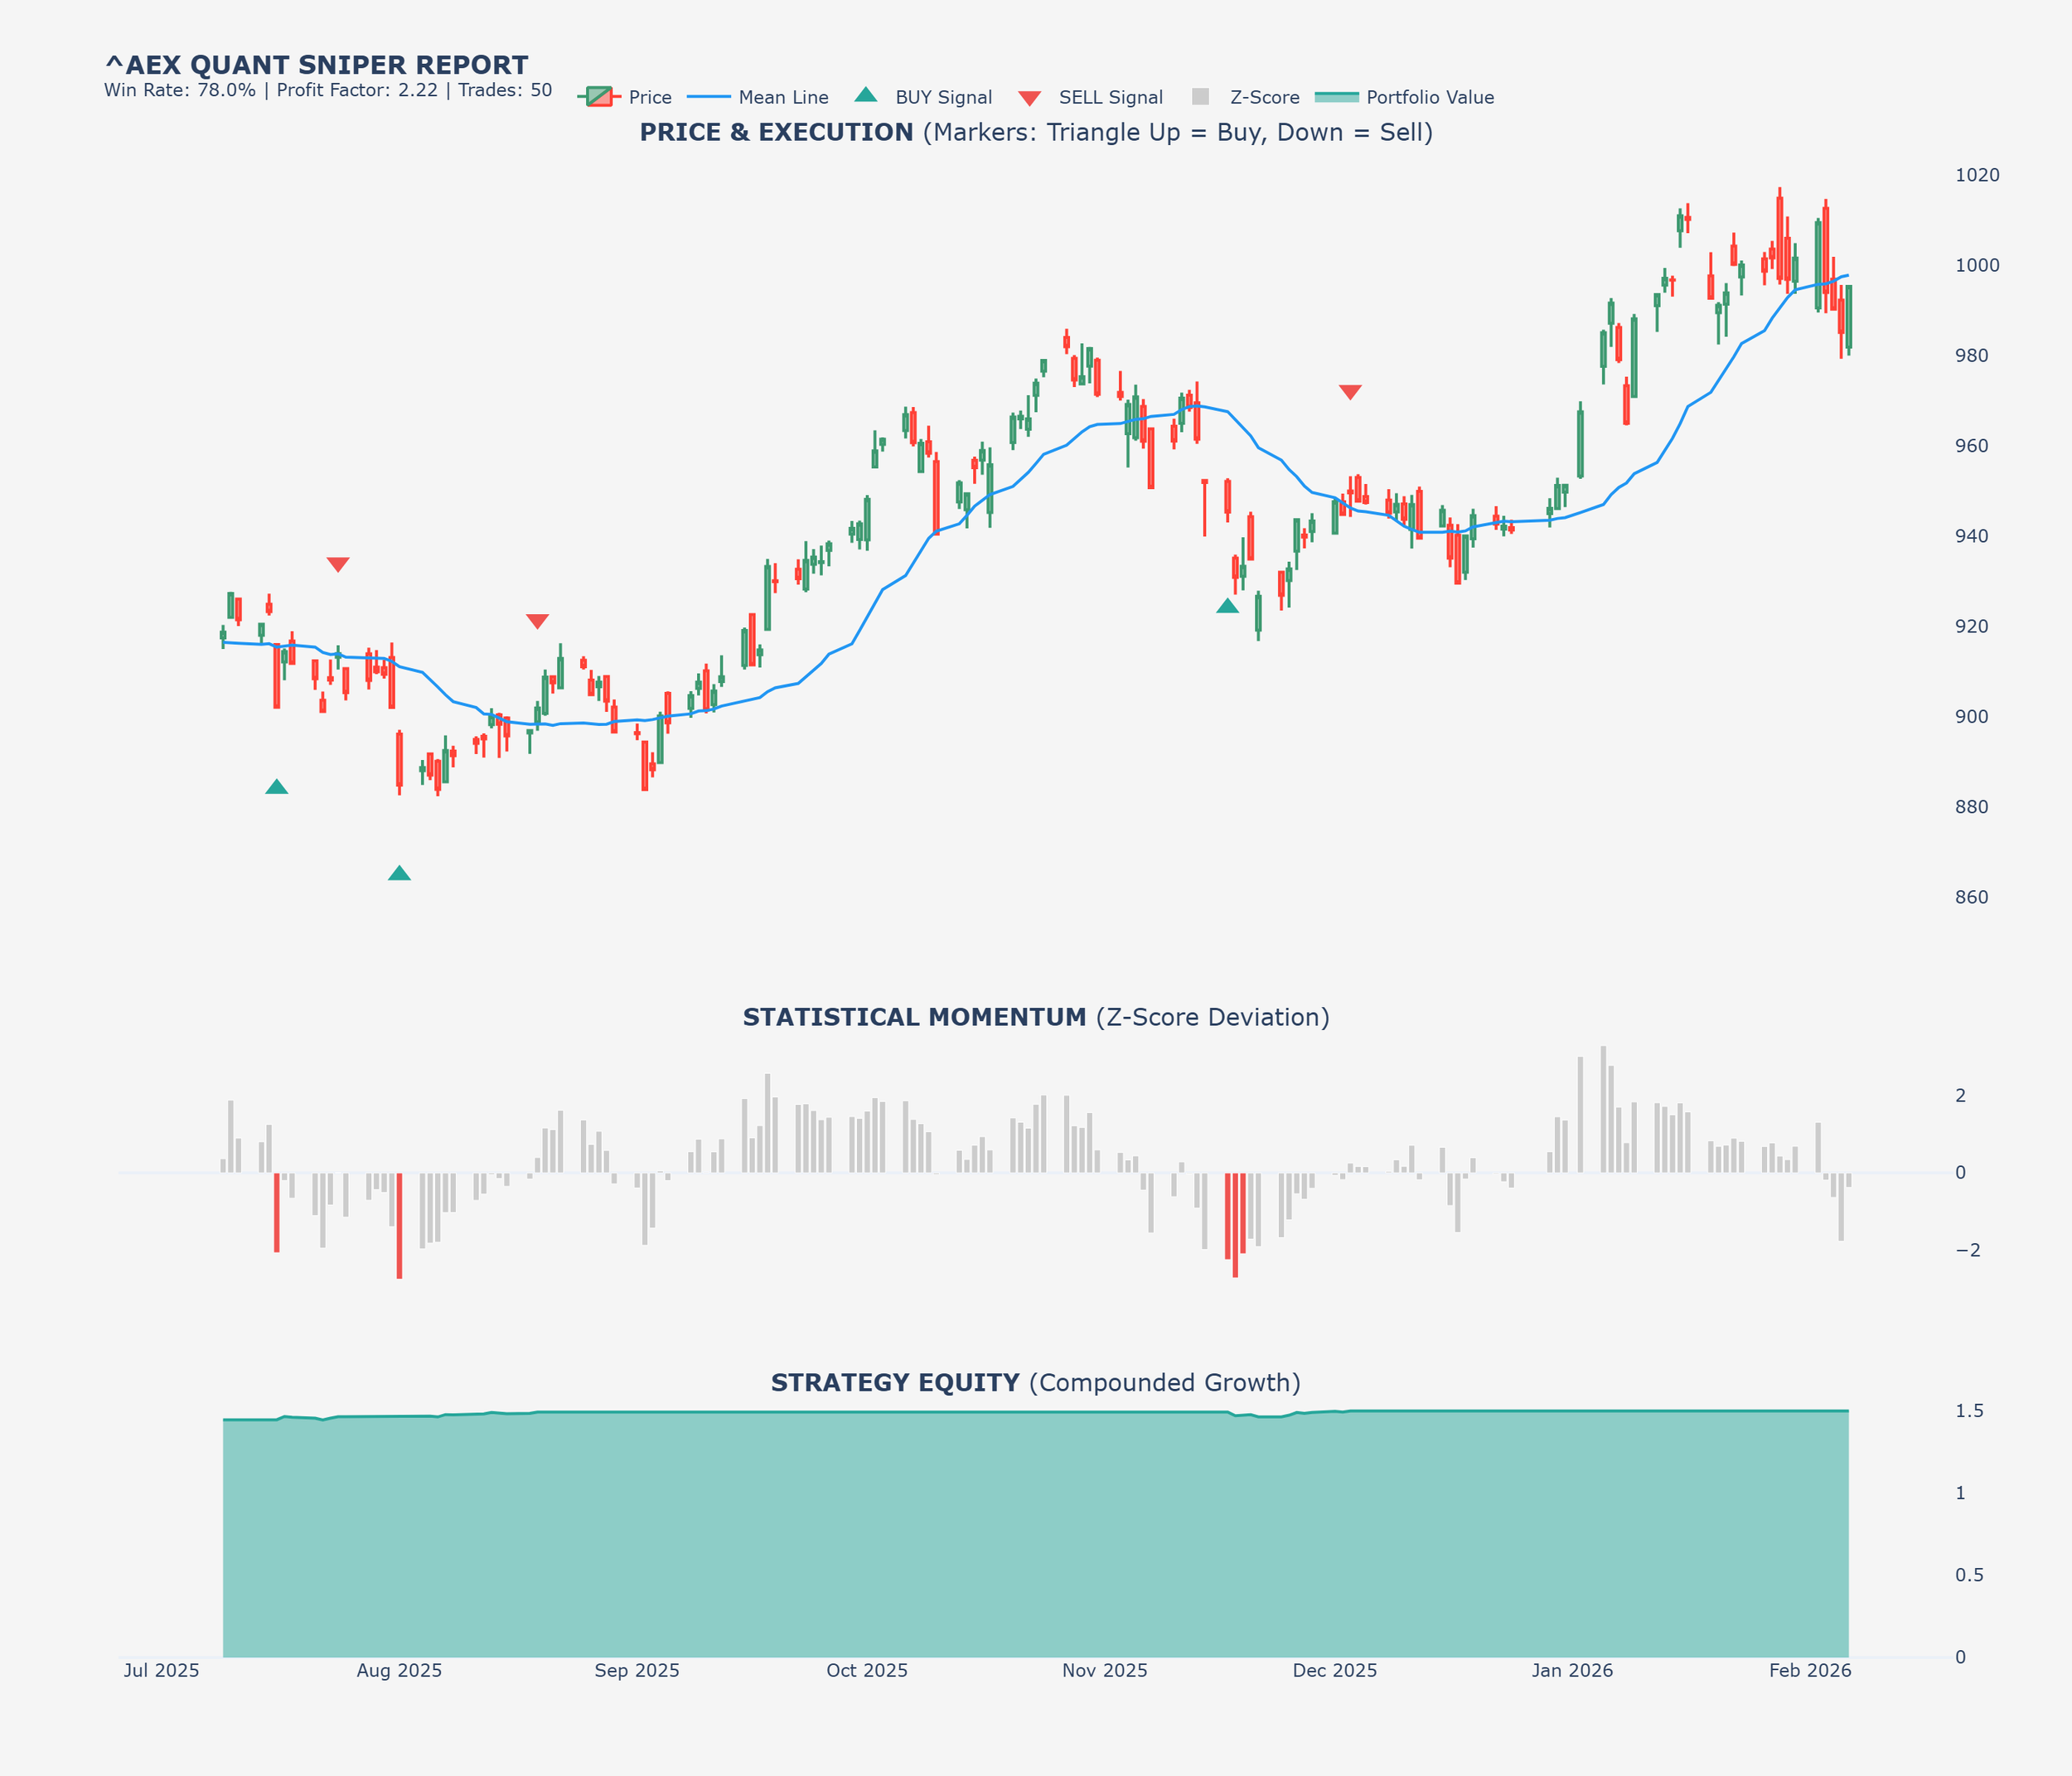
Quantitative Strategy Report: AEX Mean Reversion Sniper
Strategy Overview
The AEX Sniper is a quantitative mean-reversion strategy designed to capitalize on extreme short-term market panic. It utilizes statistical deviations (Z-Scores) to identify "oversold" conditions in the AEX Index. The core thesis is that the price of a major index acts like a rubber band: when stretched too far away from its average (SMA20), it tends to snap back to its mean.
Core Execution Logic
Entry Trigger (The Panic Buy): A long position is initiated when the Z-Score falls below -2.0. This indicates that the price is trading more than 2 standard deviations below its 20-day moving average—a state historically associated with temporary exhaustion of selling pressure.
Primary Exit (Mean Reversion): The position is closed once the price touches or exceeds the 20-day Simple Moving Average (SMA20).
Integrated Risk Management
To ensure long-term capital preservation, the strategy employs two critical "fail-safes":
Statistical Stop-Loss: If the market enters a systemic crash and the Z-Score drops below -3.5, the position is liquidated immediately to prevent catastrophic drawdowns.
Time Decay Exit: If the mean reversion target is not met within 30 trading days, the position is closed to free up capital and avoid "dead money" during prolonged sideways trends.
Performance Analysis (10-Year Backtest)
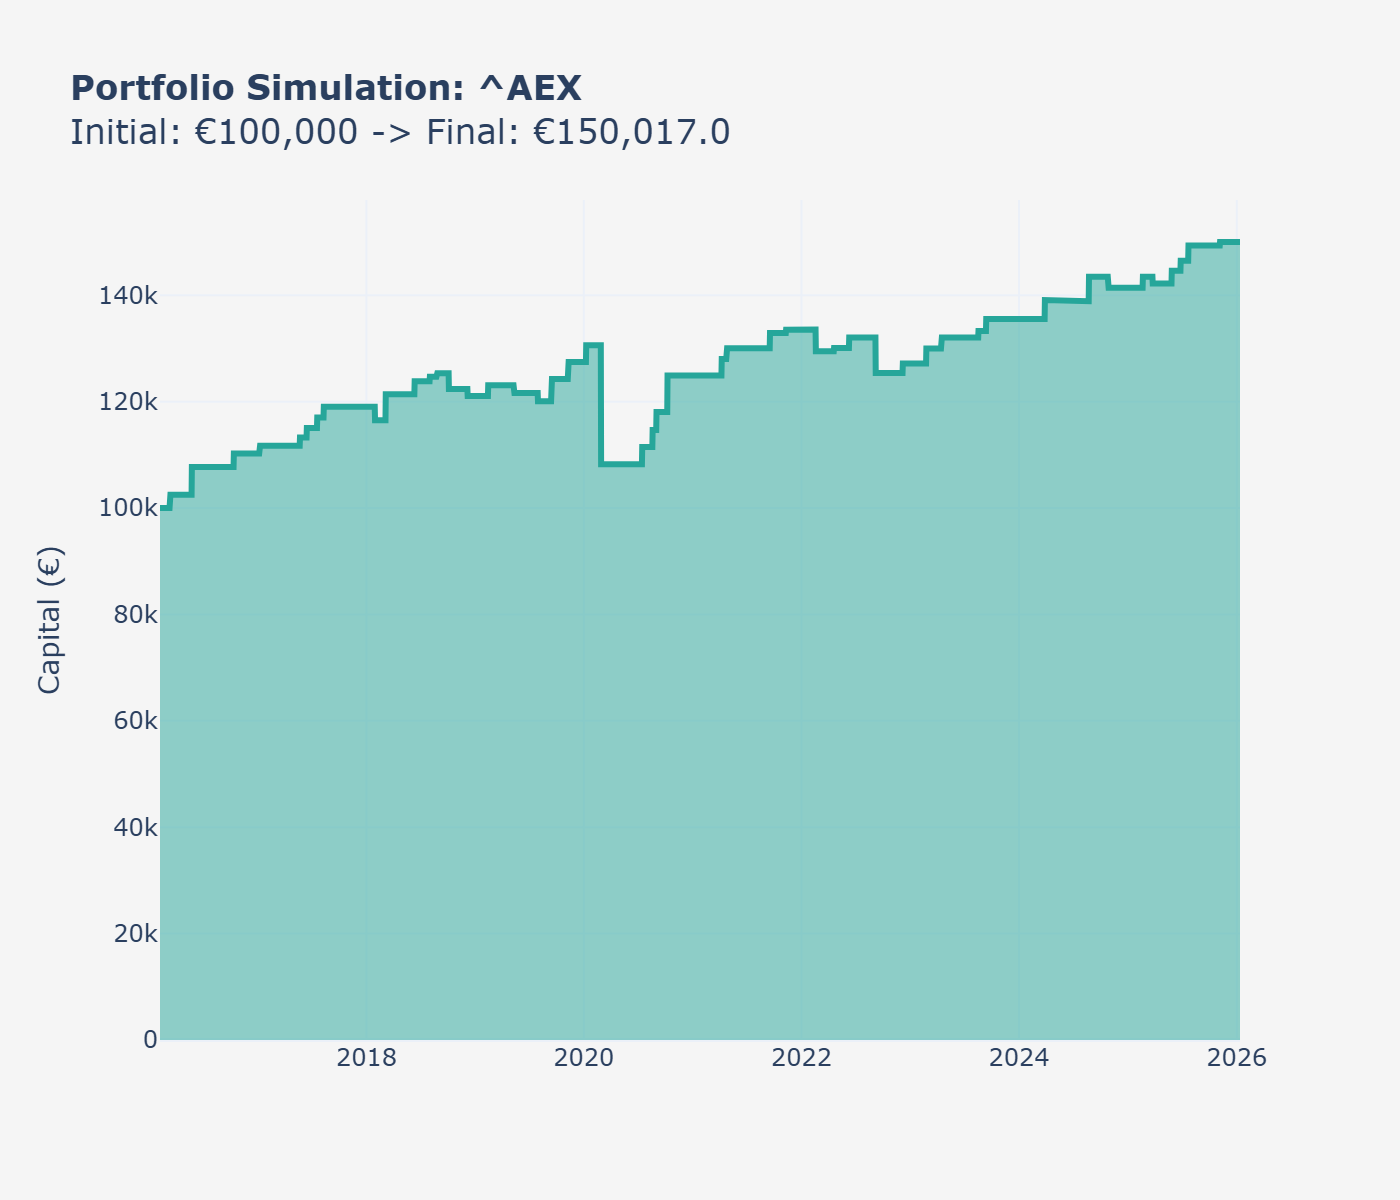
Based on the provided simulation from 2016 to 2026:
Win Rate (78.0%): Out of 50 trades, the vast majority closed in profit, proving the reliability of the AEX to return to its mean.
Profit Factor (2.22): For every €1.00 risked, the strategy generated €2.22 in gross profit.
Compounded Growth: An initial capital of €100,000 grew to €150,017, representing a 50% total return with significantly lower market exposure time compared to a "Buy & Hold" approach.
Visual Breakdown
Price & Execution (Top): Shows the candlestick patterns with green triangles (Buy) and red triangles (Sell). Notice how entries often occur at local bottoms.
Statistical Momentum (Middle): The Z-Score bars highlight volatility. Red bars signal the "Sniper" entry zone.
Strategy Equity (Bottom): Displays the steady, stair-stepping growth of the portfolio. The flat periods represent times when the strategy is in cash, avoiding market volatility.
Support My Work
Cephu is a platform built on precision, transparency, and independence. I provide these daily Quant breakdowns and on-demand analyses 100% ad-free and free to access.
Maintaining these models and providing high-quality data requires significant time and resources. If my work helps you stay focused and informed in the markets, consider supporting the project. Your contributions keep the platform running and the insights flowing.