Quantitative Research Report: The Magnetism of Fair Value
Subject: Statistical Significance of the Volume Point of Control (vPOC) in the S&P 500
Author: Cephu Research Lab
Date: February 2026
Data Horizon: Rolling 6-Month Window
1. Executive Summary
This research investigates the mean-reversion characteristics of the S&P 500 (SPX) relative to its Volume Point of Control (vPOC) and Value Area (VA). Our quantitative analysis confirms that while the SPX is a trending index, it exhibits a "magnet effect" toward historical high-volume nodes. With a 94.44% terminal fill rate, unfilled POCs (Naked POCs) serve as primary targets for medium-term mean reversion.
2. Methodology & Data Integrity
To ensure institutional-grade results, our process follows a strict data pipeline:
Data Source: Primary ticker
^SPX(S&P 500 Index) via the Yahoo Finance API, utilizing intraday 30-minute and 5-minute intervals.Pricing Engine: We utilize Typical Price ( (H+L+C)/3 ) for volume distribution rather than just closing prices to better represent the "Total Volume at Price."
The Value Area (VA) Calculation: We employ a 70% distribution algorithm. Starting from the POC, the engine expands outward, capturing the nearest price bins with the highest volume until 70% of the total daily volume is accounted for.
Fill Definition: A "Fill" or "Touch" is strictly defined as Price(Low) ≤ POC ≤ PriceHigh
3. Quantitative Results
Our backtest of the most recent market cycle yielded the following metrics:
A. The Daily Magnet (Immediate Horizon)
| Metric | Result | Interpretation |
|---|---|---|
| Next-Day POC Fill Rate | 57.14% | Moderate predictive value for day-trading. |
| Weekly POC Fill Rate | 57.69% | Consistency across timeframes. |
B. The "Unfinished Business" (Extended Horizon)
| Metric | Result | Interpretation |
|---|---|---|
| Terminal Fill Rate | 94.44% | Highly significant; almost all POCs are revisited. |
| Average Time-to-Fill | 4.55 Days | Defining the "Swing" window for mean reversion. |
4. Visualizing the Hypothesis
The following Plotly visualization demonstrates the interaction between price and the previous day's value zones. Note how the Orange Dashed Line (POC) acts as a pivot, and the Purple Shaded Area (Value Area) defines the zone of acceptance.
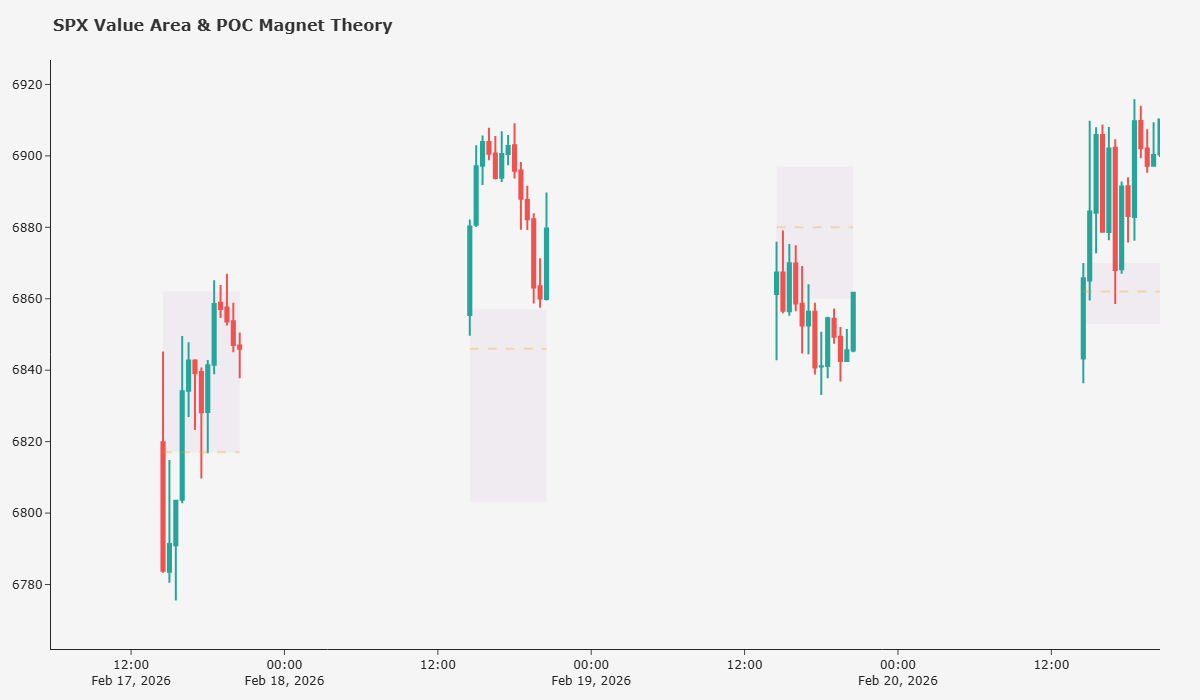
SPX Value Area & POC Magnet Theory
5. Strategic Application: The Cephu Process
Our research transitions from Quantitative Data to Discretionary Execution via the following 3-step process:
Identification (Quant): We identify "Naked POCs" (NPOCs) older than 2 days. These are our high-probability magnets.
Context (Market Profile): We monitor the "80% Rule." If the SPX opens outside the Value Area but re-enters, we initiate a bias toward the NPOC or the opposite side of the VA.
Refinement (Order Flow): We utilize Footprint Charts to witness real-time absorption. A "Magnet" level only works if the trend-driving volume shows exhaustion (e.g., decreasing Delta or Stacked Imbalances) as it approaches our target.
6. Conclusion & Sources
The data suggests that the S&P 500 remains an auction-driven market. The high terminal fill rate of 94.44% confirms that "Fair Value" is the ultimate anchor. For traders on cephu.com, the strategy is clear: Do not fight the trend, but target the gaps in value.
Data Sources:
CME Group Market Profile Handbooks
Yahoo Finance Market Data (via Python yfinance)
Internal Cephu Proprietary Backtesting Engine
Live Analysis: Active Structural Targets
The following table identifies 'Naked' Point of Control levels that remain unfilled. Statistically, these levels represent a 94.44% probability of future price interaction.
| Date | POC Level | Status |
|---|---|---|
| 2026-02-20 | 6884.0 | NAKED |