Does Missing the Best Market Days Really Destroy Returns?
Research Goal
Test the popular claim that “missing the 10 best days” drastically reduces returns.
Questions
How often do the best/worst days occur close together?
Is buy‑and‑hold superior to timing strategies?
Introduction
One of the most frequently repeated statements in personal finance is:
“If you miss the 10 best days in the market, your returns collapse.”
It’s a powerful claim — and often used to justify passive investing and discourage market timing.
But is it actually true?
And more importantly: does it still hold in modern markets where volatility clusters and cycles have changed?
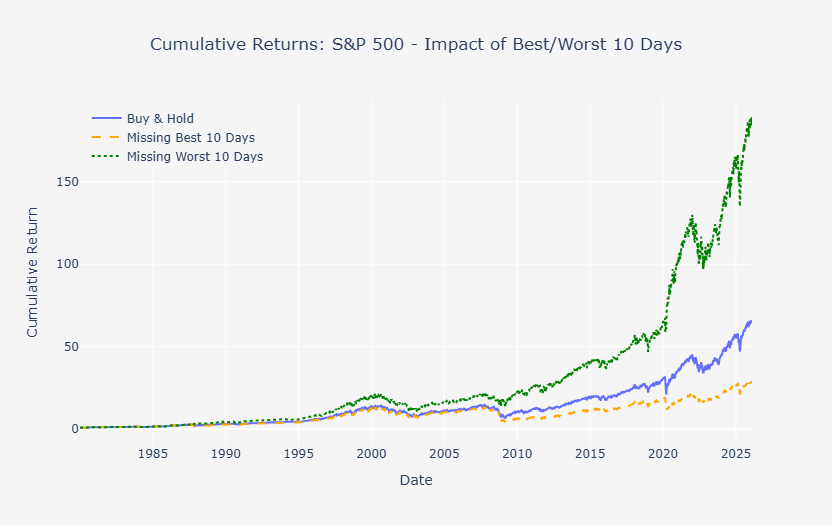
In this research note, we replicate the classic study using S&P 500 data from 1980 to 2026, identify the 10 best and 10 worst days, and analyse how missing those days affects long‑term cumulative returns.
All analysis is done in Python using free Yahoo Finance data.
Data & Methodology
Data Source
We use daily closing prices for the S&P 500 index (^GSPC) from January 1980 to January 2026, downloaded via the yfinance library.
Steps
Load S&P 500 prices
Compute daily percentage returns
Identify:
the 10 best daily returns
the 10 worst daily returns
Recompute cumulative returns for three scenarios:
Buy & Hold
Missing the 10 Best Days
Missing the 10 Worst Days
Compare the paths and ending values.
The 10 Best Days (1980–2026)
The analysis identifies the following 10 strongest daily gains (sorted by date):
| Date | Return (%) |
|---|---|
| 1987-10-13 | 11.5800% |
| 1987-10-21 | 9.0994% |
| 2008-10-28 | 10.7890% |
| 2008-11-13 | 6.9213% |
| 2008-11-24 | 6.4723% |
| 2009-03-23 | 7.0758% |
| 2020-03-13 | 9.2828% |
| 2020-03-24 | 9.3823% |
| 2020-04-06 | 7.0331% |
| 2025-04-09 | 9.5154% |
A striking observation:
Most of the best days occur during extreme market stress — 1987 crash aftermath, the 2008 financial crisis, and the COVID‑19 pandemic.
The 10 Worst Days
The results show:
| Date | Return (%) |
|---|---|
| 1987-10-19 | -20.4669% |
| 1987-10-26 | -8.2789% |
| 1997-10-27 | -6.8687% |
| 2008-09-29 | -8.0868% |
| 2008-10-09 | -7.7617% |
| 2008-10-15 | -9.0305% |
| 2008-12-01 | -8.8925% |
| 2020-03-09 | -7.5970% |